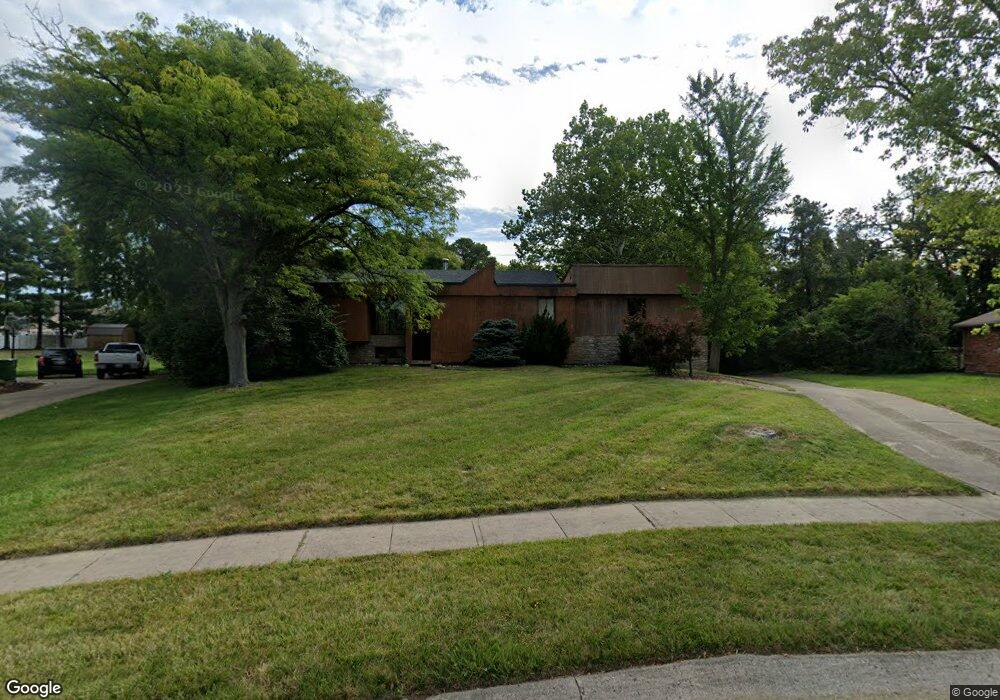
1176 Inner Circle Dr Cincinnati, OH 45240
Estimated Value: $282,000 - $385,000
4
Beds
3
Baths
3,752
Sq Ft
$92/Sq Ft
Est. Value
About This Home
This home is located at 1176 Inner Circle Dr, Cincinnati, OH 45240 and is currently estimated at $344,758, approximately $91 per square foot. 1176 Inner Circle Dr is a home located in Hamilton County with nearby schools including Calvary Academy- The.
Ownership History
Date
Name
Owned For
Owner Type
Purchase Details
Closed on
Dec 31, 2009
Sold by
Fannie Mae
Bought by
Ross Charles E
Current Estimated Value
Home Financials for this Owner
Home Financials are based on the most recent Mortgage that was taken out on this home.
Original Mortgage
$110,461
Outstanding Balance
$71,784
Interest Rate
4.75%
Mortgage Type
FHA
Estimated Equity
$272,974
Purchase Details
Closed on
Oct 27, 2009
Sold by
Marrow Joseph
Bought by
Fannie Mae and Federal National Mortgage Association
Purchase Details
Closed on
Oct 6, 1999
Sold by
Hunter William H and Hunter Ann Ronda
Bought by
Marrow Joseph S and Marrow Mary P
Home Financials for this Owner
Home Financials are based on the most recent Mortgage that was taken out on this home.
Original Mortgage
$150,400
Interest Rate
10.8%
Create a Home Valuation Report for This Property
The Home Valuation Report is an in-depth analysis detailing your home's value as well as a comparison with similar homes in the area
Home Values in the Area
Average Home Value in this Area
Purchase History
| Date | Buyer | Sale Price | Title Company |
|---|---|---|---|
| Ross Charles E | $112,500 | Attorney | |
| Fannie Mae | $136,913 | None Available | |
| Marrow Joseph S | $188,000 | Blue Chip Title Agency Inc |
Source: Public Records
Mortgage History
| Date | Status | Borrower | Loan Amount |
|---|---|---|---|
| Open | Ross Charles E | $110,461 | |
| Previous Owner | Marrow Joseph S | $150,400 |
Source: Public Records
Tax History
| Year | Tax Paid | Tax Assessment Tax Assessment Total Assessment is a certain percentage of the fair market value that is determined by local assessors to be the total taxable value of land and additions on the property. | Land | Improvement |
|---|---|---|---|---|
| 2025 | $4,940 | $83,938 | $14,627 | $69,311 |
| 2024 | $4,807 | $83,938 | $14,627 | $69,311 |
| 2023 | $4,874 | $83,938 | $14,627 | $69,311 |
| 2022 | $5,747 | $74,932 | $11,008 | $63,924 |
| 2021 | $5,613 | $74,932 | $11,008 | $63,924 |
| 2020 | $5,685 | $74,932 | $11,008 | $63,924 |
| 2019 | $5,395 | $62,444 | $9,174 | $53,270 |
| 2018 | $5,408 | $62,444 | $9,174 | $53,270 |
| 2017 | $5,203 | $62,444 | $9,174 | $53,270 |
| 2016 | $3,180 | $37,405 | $9,622 | $27,783 |
| 2015 | $2,951 | $37,405 | $9,622 | $27,783 |
| 2014 | $2,724 | $37,405 | $9,622 | $27,783 |
| 2013 | $2,809 | $39,375 | $10,129 | $29,246 |
Source: Public Records
Map
Nearby Homes
- 1251 Waycross Rd
- 11342 Kenshire Dr
- 1480 Kelvin Ct
- 1314 Waycross Rd
- 1477 Kelvin Ct
- 11315 Lincolnshire Dr
- 11131 Hanover Rd
- 1248 Komura Ct
- 888 W Kemper Rd
- 11418 Lyncross Dr
- 11431 Fremantle Dr
- 1566 Karahill Dr
- 784 Farnham Ct
- 1413 Waycross Rd
- 11481 Fremantle Dr
- 749 Converse Dr
- 68 Gambier Cir
- 30 Gambier Cir
- 683 Danbury Rd
- 11 Dewitt Ct
- 1180 Inner Circle Dr
- 1172 Inner Circle Dr
- 1179 Inner Circle Dr
- 1184 Inner Circle Dr
- 1168 Inner Circle Dr
- 1099 Waycross Rd
- 1171 Inner Circle Dr
- 1113 Waycross Rd
- 1188 Inner Circle Dr
- 1093 Waycross Rd
- 1119 Waycross Rd
- 1189 Inner Circle Dr
- 1167 Inner Circle Dr
- 1164 Inner Circle Dr
- 1085 Waycross Rd
- 1125 Waycross Rd
- 1105 Inner Circle Dr
- 1157 Inner Circle Dr
- 1079 Waycross Rd
- 1108 Inner Circle Dr
Your Personal Tour Guide
Ask me questions while you tour the home.