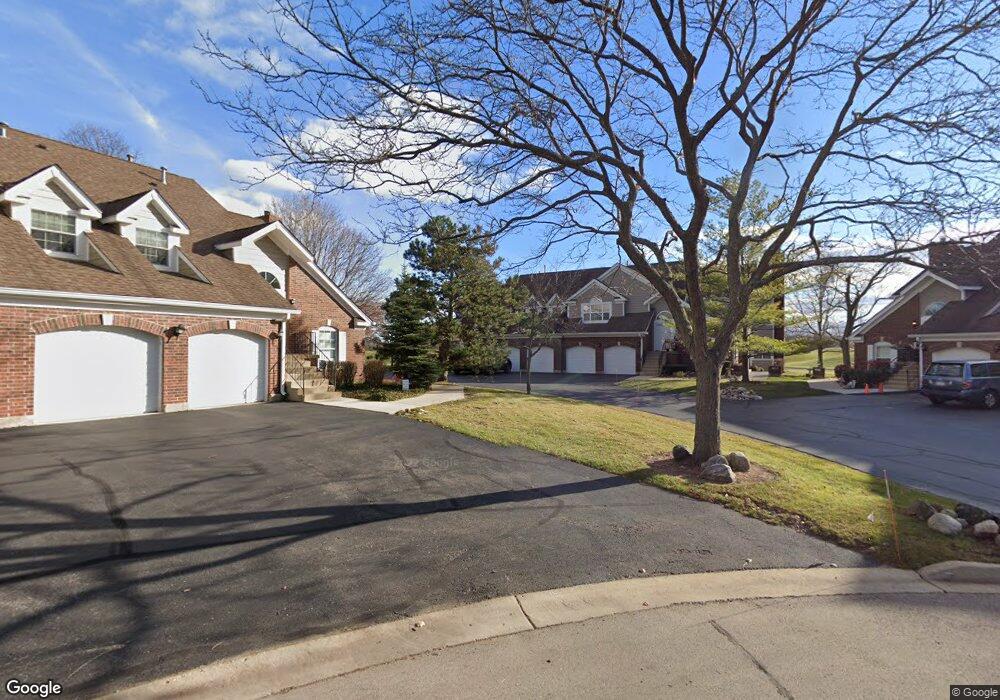
1177 Saint Andrews Ct Unit 243 Algonquin, IL 60102
Estimated Value: $275,000 - $292,143
2
Beds
2
Baths
1,649
Sq Ft
$172/Sq Ft
Est. Value
About This Home
This home is located at 1177 Saint Andrews Ct Unit 243, Algonquin, IL 60102 and is currently estimated at $284,036, approximately $172 per square foot. 1177 Saint Andrews Ct Unit 243 is a home located in McHenry County with nearby schools including Westfield Community School, Kenneth E Neubert Elementary School, and Harry D Jacobs High School.
Ownership History
Date
Name
Owned For
Owner Type
Purchase Details
Closed on
Oct 14, 2025
Sold by
Mosqueda Gina
Bought by
Gina Lisa Mosqueda Living Trust and Mosqueda
Current Estimated Value
Purchase Details
Closed on
Apr 8, 2020
Sold by
Sekula Matthew R and Sekula Ashley H
Bought by
Mosqueda Gina
Home Financials for this Owner
Home Financials are based on the most recent Mortgage that was taken out on this home.
Original Mortgage
$174,600
Interest Rate
3.5%
Mortgage Type
New Conventional
Purchase Details
Closed on
Jan 12, 2006
Sold by
Oconnell Cornelius and Oconnell Eileen
Bought by
Sekula Matthew R and Sekula Ashley H
Home Financials for this Owner
Home Financials are based on the most recent Mortgage that was taken out on this home.
Original Mortgage
$41,600
Interest Rate
6.46%
Mortgage Type
Fannie Mae Freddie Mac
Purchase Details
Closed on
Oct 31, 1996
Sold by
Nergard Frances F
Bought by
Oconnell Cornelius and Oconnell Eileen
Create a Home Valuation Report for This Property
The Home Valuation Report is an in-depth analysis detailing your home's value as well as a comparison with similar homes in the area
Home Values in the Area
Average Home Value in this Area
Purchase History
| Date | Buyer | Sale Price | Title Company |
|---|---|---|---|
| Gina Lisa Mosqueda Living Trust | -- | None Listed On Document | |
| Gina Lisa Mosqueda Living Trust | -- | None Listed On Document | |
| Mosqueda Gina | $180,000 | Chicago Title | |
| Mosqueda Gina | $180,000 | Chicago Title | |
| Sekula Matthew R | $208,000 | Chicago Title Insurance Co | |
| Sekula Matthew R | $208,000 | Chicago Title Insurance Co | |
| Oconnell Cornelius | $121,500 | -- | |
| Oconnell Cornelius | $121,500 | -- |
Source: Public Records
Mortgage History
| Date | Status | Borrower | Loan Amount |
|---|---|---|---|
| Previous Owner | Mosqueda Gina | $174,600 | |
| Previous Owner | Sekula Matthew R | $41,600 | |
| Previous Owner | Sekula Matthew R | $166,400 |
Source: Public Records
Tax History Compared to Growth
Tax History
| Year | Tax Paid | Tax Assessment Tax Assessment Total Assessment is a certain percentage of the fair market value that is determined by local assessors to be the total taxable value of land and additions on the property. | Land | Improvement |
|---|---|---|---|---|
| 2024 | $5,166 | $74,044 | $15,898 | $58,146 |
| 2023 | $4,874 | $66,223 | $14,219 | $52,004 |
| 2022 | $4,884 | $62,947 | $22,054 | $40,893 |
| 2021 | $4,671 | $58,643 | $20,546 | $38,097 |
| 2020 | $5,079 | $56,567 | $19,819 | $36,748 |
| 2019 | $4,971 | $54,141 | $18,969 | $35,172 |
| 2018 | $4,929 | $51,709 | $17,523 | $34,186 |
| 2017 | $4,851 | $48,713 | $16,508 | $32,205 |
| 2016 | $4,804 | $45,688 | $15,483 | $30,205 |
| 2013 | -- | $46,464 | $14,444 | $32,020 |
Source: Public Records
Map
Nearby Homes
- 1405 Surrey Ln
- 1 N Hubbard St
- SWC Talaga and Algonquin Rd
- 2043 Peach Tree Ln Unit 4122
- 1820 Crofton Dr
- 1801 Arbordale Ln
- 1900 Waverly Ln
- 741 Regal Ln
- 000 County Line Rd
- 30 Arbordale Ct Unit 4284
- 700 Fairfield Ln
- 710 Braewood Dr
- 710 Sprucetree Ln
- 2233 Dawson Ln Unit 312
- Adams Plan at Algonquin Meadows - Single Family
- Sequoia Plan at Algonquin Meadows - Single Family
- Bryce Plan at Algonquin Meadows - Single Family
- Rainier Plan at Algonquin Meadows - Single Family
- Santa Rosa Plan at Algonquin Meadows - Single Family
- Biscayne Plan at Algonquin Meadows - Single Family
- 1177 St Andrews Ct
- 1175 Saint Andrews Ct Unit 241
- 1173 Saint Andrews Ct Unit 244
- 1173 St Andrews Ct
- 1171 Saint Andrews Ct
- 1158 Saint Andrews Ct Unit 234
- 1158 St Andrews Ct Unit 1158
- 1156 Saint Andrews Ct
- 1167 Saint Andrews Ct Unit 253
- 1167 St Andrews Ct
- 1167 St Andrews Ct Unit 1167
- 1165 Saint Andrews Ct
- 1165 St Andrews Ct Unit 1165
- 1154 St Andrews Ct Unit 1154
- 1154 Saint Andrews Ct Unit 233
- 1154 Saint Andrews Ct Unit 1154
- 1163 Saint Andrews Ct
- 1152 Saint Andrews Ct Unit 231
- 1152 St Andrews Ct Unit 1152
- 1161 Saint Andrews Ct