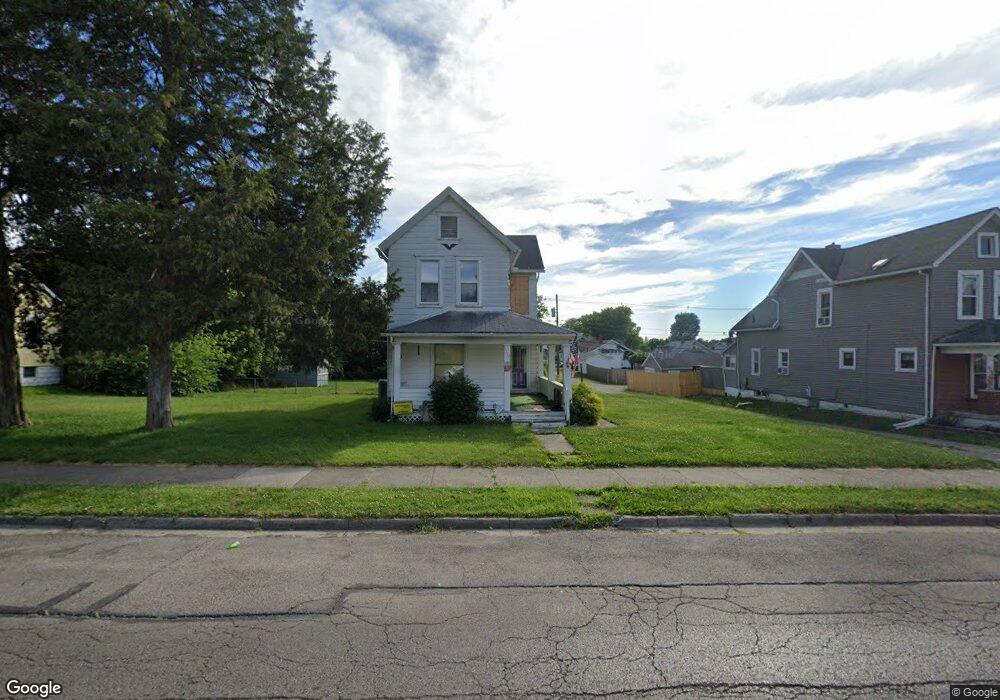
1177 Selma Rd Springfield, OH 45505
Estimated Value: $100,000 - $198,000
3
Beds
1
Bath
1,314
Sq Ft
$114/Sq Ft
Est. Value
About This Home
This home is located at 1177 Selma Rd, Springfield, OH 45505 and is currently estimated at $150,333, approximately $114 per square foot. 1177 Selma Rd is a home located in Clark County with nearby schools including Kenwood Elementary School, Hayward Middle School, and Springfield High School.
Ownership History
Date
Name
Owned For
Owner Type
Purchase Details
Closed on
Sep 18, 2024
Sold by
Delawder Timothy W and Delawder Rebecca I
Bought by
Lucner Marc
Current Estimated Value
Purchase Details
Closed on
Jan 3, 2019
Sold by
Delawder Larry
Bought by
Delawder Timothy W and Delawder Rebecca I
Purchase Details
Closed on
Jul 20, 2012
Sold by
Taylor Mary Ellen and Taylor Roger A
Bought by
Hoelscher Carl E and Hoelscher Nichole J
Home Financials for this Owner
Home Financials are based on the most recent Mortgage that was taken out on this home.
Original Mortgage
$18,400
Interest Rate
6%
Mortgage Type
Seller Take Back
Purchase Details
Closed on
Mar 30, 2012
Sold by
Dalton Shelby R
Bought by
Taylor Mary Ellen
Purchase Details
Closed on
Nov 19, 1992
Sold by
Bowen Earl and Bowen Gladys L
Bought by
Dalton Shelby R and Dalton Barbara A
Purchase Details
Closed on
Dec 27, 1991
Create a Home Valuation Report for This Property
The Home Valuation Report is an in-depth analysis detailing your home's value as well as a comparison with similar homes in the area
Home Values in the Area
Average Home Value in this Area
Purchase History
We collect this data history from publicly available records. To have your information removed, we recommend requesting removal directly through your county’s website.
| Date | Buyer | Sale Price | Title Company |
|---|---|---|---|
| Lucner Marc | $6,900 | Empora Title Llc | |
| Lucner Marc | $6,900 | Empora Title Llc | |
| Delawder Timothy W | -- | None Available | |
| Hoelscher Carl E | $23,000 | None Available | |
| Taylor Mary Ellen | $10,000 | None Available | |
| Dalton Shelby R | $41,000 | -- | |
| -- | $40,000 | -- |
Source: Public Records
Mortgage History
We collect this data history from publicly available records. To have your information removed, we recommend requesting removal directly through your county’s website.
| Date | Status | Borrower | Loan Amount |
|---|---|---|---|
| Previous Owner | Hoelscher Carl E | $18,400 |
Source: Public Records
Tax History
| Year | Tax Paid | Tax Assessment Tax Assessment Total Assessment is a certain percentage of the fair market value that is determined by local assessors to be the total taxable value of land and additions on the property. | Land | Improvement |
|---|---|---|---|---|
| 2025 | $4,907 | $1,630 | $1,630 | -- |
| 2024 | $9,161 | $1,280 | $1,280 | -- |
| 2023 | $4,644 | $5,810 | $1,280 | $4,530 |
| 2022 | $7,703 | $17,780 | $2,570 | $15,210 |
| 2021 | $875 | $16,370 | $2,330 | $14,040 |
| 2020 | $877 | $16,370 | $2,330 | $14,040 |
| 2019 | $879 | $16,370 | $2,330 | $14,040 |
| 2018 | $450 | $8,050 | $1,940 | $6,110 |
| 2017 | $450 | $17,298 | $1,943 | $15,355 |
| 2016 | $450 | $17,298 | $1,943 | $15,355 |
| 2015 | $230 | $17,298 | $1,943 | $15,355 |
| 2014 | $982 | $17,298 | $1,943 | $15,355 |
| 2013 | $972 | $17,298 | $1,943 | $15,355 |
Source: Public Records
Map
Nearby Homes
- 1027 Lafayette Ave
- 1008 Tibbetts Ave
- 550 E Rose St
- 453 E Pleasant St
- 501 E Southern Ave
- 705 York St
- 441 E Euclid Ave
- 1628 Kenton St
- 625 Tibbetts Ave
- 1322 Linden Ave
- 1625 E Pleasant St
- 1705 Rutland Ave
- 1652 Kenton St
- 1724 Clay St
- 1907 Maryland Ave
- 205 E Grand Ave
- 1846 Ohio Ave
- 1609 Irwin Ave
- 360 S Greenmount Ave
- 371 Hensel Ave
Your Personal Tour Guide
Ask me questions while you tour the home.