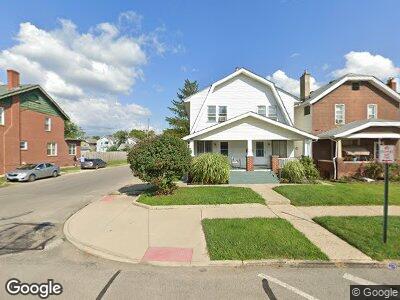
1178 S Ohio Ave Unit 182 Columbus, OH 43206
Karns Park NeighborhoodEstimated Value: $305,832 - $385,000
6
Beds
2
Baths
2,464
Sq Ft
$138/Sq Ft
Est. Value
About This Home
This home is located at 1178 S Ohio Ave Unit 182, Columbus, OH 43206 and is currently estimated at $339,958, approximately $137 per square foot. 1178 S Ohio Ave Unit 182 is a home located in Franklin County with nearby schools including Moler Elementary School, South High School, and Capital Collegiate Preparatory Academy.
Ownership History
Date
Name
Owned For
Owner Type
Purchase Details
Closed on
Nov 18, 2003
Sold by
Barrowman Thomas E and Barrowman Joyce E
Bought by
Johnson Richard
Current Estimated Value
Home Financials for this Owner
Home Financials are based on the most recent Mortgage that was taken out on this home.
Original Mortgage
$75,175
Interest Rate
6.1%
Mortgage Type
Purchase Money Mortgage
Purchase Details
Closed on
Dec 11, 1996
Sold by
Harris Cheryl K
Bought by
Barrowman Thomas E and Barrowman Joyce E
Home Financials for this Owner
Home Financials are based on the most recent Mortgage that was taken out on this home.
Original Mortgage
$41,000
Interest Rate
7.85%
Mortgage Type
New Conventional
Purchase Details
Closed on
Oct 11, 1989
Create a Home Valuation Report for This Property
The Home Valuation Report is an in-depth analysis detailing your home's value as well as a comparison with similar homes in the area
Home Values in the Area
Average Home Value in this Area
Purchase History
| Date | Buyer | Sale Price | Title Company |
|---|---|---|---|
| Johnson Richard | $77,500 | -- | |
| Barrowman Thomas E | $30,666 | -- | |
| -- | -- | -- |
Source: Public Records
Mortgage History
| Date | Status | Borrower | Loan Amount |
|---|---|---|---|
| Open | Johnson Richard | $103,500 | |
| Closed | Johnson Richard | $121,500 | |
| Closed | Johnson Richard | $97,832 | |
| Closed | Johnson Richard | $15,573 | |
| Closed | Johnson Richard | $75,175 | |
| Previous Owner | Barrowman Thomas E | $48,382 | |
| Previous Owner | Barrowman Thomas E | $41,000 |
Source: Public Records
Tax History Compared to Growth
Tax History
| Year | Tax Paid | Tax Assessment Tax Assessment Total Assessment is a certain percentage of the fair market value that is determined by local assessors to be the total taxable value of land and additions on the property. | Land | Improvement |
|---|---|---|---|---|
| 2024 | $4,023 | $87,790 | $22,510 | $65,280 |
| 2023 | $3,973 | $87,780 | $22,505 | $65,275 |
| 2022 | $1,892 | $35,600 | $5,430 | $30,170 |
| 2021 | $1,895 | $35,600 | $5,430 | $30,170 |
| 2020 | $1,898 | $35,600 | $5,430 | $30,170 |
| 2019 | $1,703 | $27,380 | $4,170 | $23,210 |
| 2018 | $1,629 | $27,380 | $4,170 | $23,210 |
| 2017 | $1,702 | $27,380 | $4,170 | $23,210 |
| 2016 | $1,714 | $25,550 | $3,360 | $22,190 |
| 2015 | $1,558 | $25,550 | $3,360 | $22,190 |
| 2014 | $1,562 | $25,550 | $3,360 | $22,190 |
| 2013 | $812 | $26,915 | $3,570 | $23,345 |
Source: Public Records
Map
Nearby Homes
- 1209 S Champion Ave
- 1222 S Champion Ave
- 1113 S Ohio Ave Unit 1115
- 1146 S Champion Ave Unit 1148
- 1238 S 22nd St
- 1256 S Champion Ave
- 1269 S Champion Ave
- 829 Siebert St
- 1170-1172 Oakwood Ave
- 799 E Deshler Ave
- 1284-1286 S Champion Ave
- 837 Reinhard Ave
- 1077-1079 S Ohio Ave
- 1286-1288 Oakwood Ave
- 834 Reinhard Ave
- 1038 Reinhard Ave
- 1324 Oakwood Ave
- 850 E Whittier St
- 846 E Whittier St
- 811 E Whittier St
- 1178 S Ohio Ave Unit 182
- 1178 S Ohio Ave Unit 2
- 1184 S Ohio Ave
- 1180 S Ohio Ave Unit 2
- 1188 S Ohio Ave
- 1192 S Ohio Ave
- 1164 S Ohio Ave
- 1164-1170 S Ohio Ave
- 1196 S Ohio Ave
- 1202 S Ohio Ave
- 1189 S Champion Ave
- 1193 S Champion Ave
- 1195 S Champion Ave Unit 197
- 1206 S Ohio Ave
- 1177 S Champion Ave Unit 179
- 1156 S Ohio Ave
- 1177-1179 S Champion Ave
- 1201 S Champion Ave
- 1177-1179 S Ohio Ave
- 1177 S Ohio Ave Unit 179