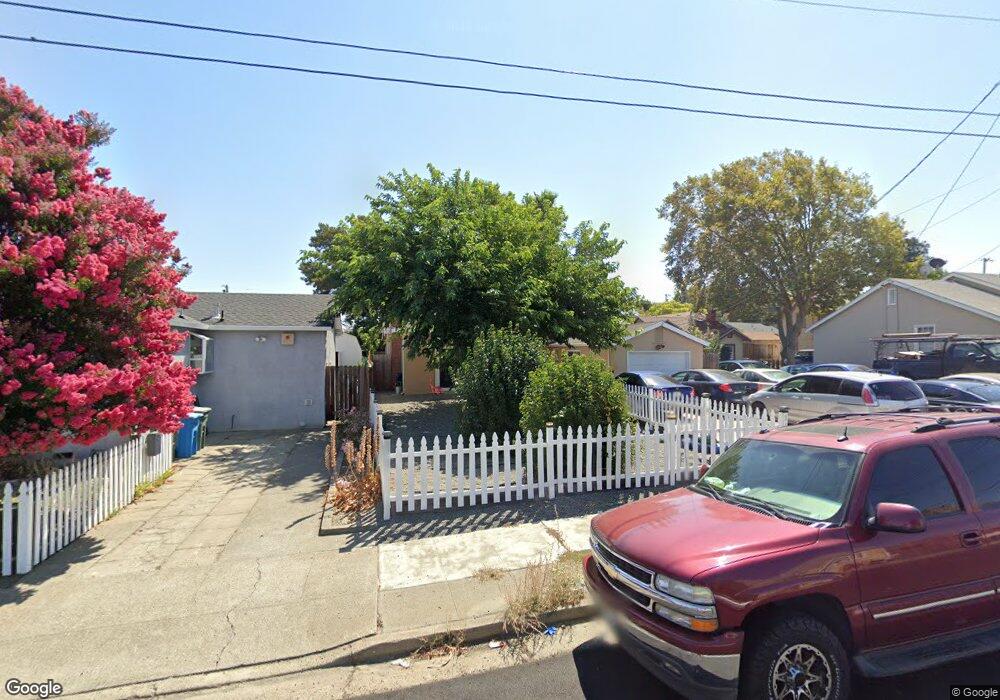
118 13th St Vallejo, CA 94590
West Vallejo NeighborhoodEstimated Value: $321,000 - $492,000
2
Beds
1
Bath
1,456
Sq Ft
$274/Sq Ft
Est. Value
About This Home
This home is located at 118 13th St, Vallejo, CA 94590 and is currently estimated at $398,947, approximately $274 per square foot. 118 13th St is a home located in Solano County with nearby schools including Steffan Manor Elementary, Vallejo High School, and Mustard Seed Preschool and Kindergarten.
Ownership History
Date
Name
Owned For
Owner Type
Purchase Details
Closed on
Jun 11, 2025
Sold by
Sok Family Living Trust and Sok Yung
Bought by
Sok Family Living Trust and Sok
Current Estimated Value
Home Financials for this Owner
Home Financials are based on the most recent Mortgage that was taken out on this home.
Original Mortgage
$249,000
Outstanding Balance
$248,361
Interest Rate
6.81%
Mortgage Type
Credit Line Revolving
Estimated Equity
$150,586
Purchase Details
Closed on
Jan 14, 2020
Sold by
Sok Yung and Ly Ling
Bought by
Sok Yung and Ly Ling
Purchase Details
Closed on
Dec 23, 2014
Sold by
Smith Larry
Bought by
Sok Yung and Ly Ling
Purchase Details
Closed on
Sep 2, 1999
Sold by
Stephenson Wilma L
Bought by
Stephenson Harold L and Stephenson Wilma L
Create a Home Valuation Report for This Property
The Home Valuation Report is an in-depth analysis detailing your home's value as well as a comparison with similar homes in the area
Home Values in the Area
Average Home Value in this Area
Purchase History
| Date | Buyer | Sale Price | Title Company |
|---|---|---|---|
| Sok Family Living Trust | -- | Chicago Title Company | |
| Sok Yung | -- | None Available | |
| Sok Yung | $169,000 | First American Title Company | |
| Stephenson Harold L | -- | -- | |
| Stephenson Harold L | -- | -- |
Source: Public Records
Mortgage History
| Date | Status | Borrower | Loan Amount |
|---|---|---|---|
| Open | Sok Family Living Trust | $249,000 |
Source: Public Records
Tax History
| Year | Tax Paid | Tax Assessment Tax Assessment Total Assessment is a certain percentage of the fair market value that is determined by local assessors to be the total taxable value of land and additions on the property. | Land | Improvement |
|---|---|---|---|---|
| 2025 | $3,383 | $203,103 | $36,050 | $167,053 |
| 2024 | $3,383 | $199,122 | $35,344 | $163,778 |
| 2023 | $3,163 | $195,218 | $34,651 | $160,567 |
| 2022 | $3,061 | $191,391 | $33,973 | $157,418 |
| 2021 | $2,993 | $187,639 | $33,307 | $154,332 |
| 2020 | $2,994 | $185,716 | $32,966 | $152,750 |
| 2019 | $2,892 | $182,075 | $32,320 | $149,755 |
| 2018 | $2,700 | $178,506 | $31,687 | $146,819 |
| 2017 | $2,569 | $175,007 | $31,066 | $143,941 |
| 2016 | $1,999 | $171,576 | $30,457 | $141,119 |
| 2015 | $1,973 | $169,000 | $30,000 | $139,000 |
| 2014 | $492 | $38,732 | $10,379 | $28,353 |
Source: Public Records
Map
Nearby Homes
Your Personal Tour Guide
Ask me questions while you tour the home.