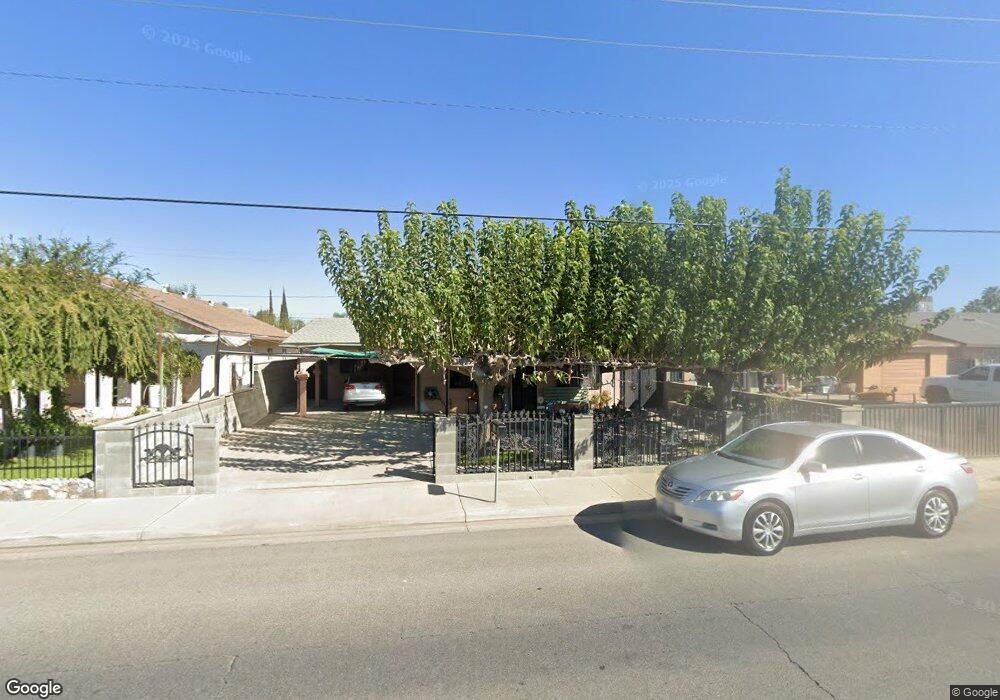
118 Albany St Delano, CA 93215
West Delano NeighborhoodEstimated Value: $221,000 - $326,000
4
Beds
1
Bath
1,040
Sq Ft
$268/Sq Ft
Est. Value
About This Home
This home is located at 118 Albany St, Delano, CA 93215 and is currently estimated at $279,195, approximately $268 per square foot. 118 Albany St is a home located in Kern County with nearby schools including Almond Tree Middle School, Cesar E. Chavez High School, and Nueva Vista Language Academy.
Ownership History
Date
Name
Owned For
Owner Type
Purchase Details
Closed on
Apr 12, 2012
Sold by
Salazar Glafira G and Santiago Salazar A
Bought by
Salazar Gricel and Salazar Rene
Current Estimated Value
Purchase Details
Closed on
Feb 6, 1998
Sold by
Salazar Glafira G and Salazar Santiago
Bought by
Salazar Santiago A and Salazar Glafira G
Home Financials for this Owner
Home Financials are based on the most recent Mortgage that was taken out on this home.
Original Mortgage
$33,000
Interest Rate
7.02%
Purchase Details
Closed on
Jan 26, 1998
Sold by
Salazar Glafira G
Bought by
Salazar Glafira G and Salazar Santiago
Home Financials for this Owner
Home Financials are based on the most recent Mortgage that was taken out on this home.
Original Mortgage
$33,000
Interest Rate
7.02%
Purchase Details
Closed on
Mar 23, 1995
Sold by
Salazar Glafira G
Bought by
Salazar Glafira G and Salazar Santiago
Purchase Details
Closed on
Jul 21, 1994
Sold by
Degonzalez Maria L and Mejia Eva G
Bought by
Degonzalez Maria L and Salazar Glafira Gonzalez
Create a Home Valuation Report for This Property
The Home Valuation Report is an in-depth analysis detailing your home's value as well as a comparison with similar homes in the area
Home Values in the Area
Average Home Value in this Area
Purchase History
| Date | Buyer | Sale Price | Title Company |
|---|---|---|---|
| Salazar Gricel | -- | None Available | |
| Salazar Santiago A | -- | Chicago Title Co | |
| Salazar Glafira G | -- | -- | |
| Salazar Glafira G | -- | -- | |
| Degonzalez Maria L | -- | -- |
Source: Public Records
Mortgage History
| Date | Status | Borrower | Loan Amount |
|---|---|---|---|
| Closed | Salazar Santiago A | $33,000 |
Source: Public Records
Tax History Compared to Growth
Tax History
| Year | Tax Paid | Tax Assessment Tax Assessment Total Assessment is a certain percentage of the fair market value that is determined by local assessors to be the total taxable value of land and additions on the property. | Land | Improvement |
|---|---|---|---|---|
| 2025 | $1,047 | $86,487 | $12,813 | $73,674 |
| 2024 | $1,014 | $84,793 | $12,562 | $72,231 |
| 2023 | $1,014 | $83,132 | $12,316 | $70,816 |
| 2022 | $992 | $81,503 | $12,075 | $69,428 |
| 2021 | $927 | $79,907 | $11,839 | $68,068 |
| 2020 | $914 | $79,089 | $11,718 | $67,371 |
| 2019 | $898 | $79,089 | $11,718 | $67,371 |
| 2018 | $885 | $76,022 | $11,264 | $64,758 |
| 2017 | $889 | $74,534 | $11,044 | $63,490 |
| 2016 | $874 | $73,074 | $10,828 | $62,246 |
| 2015 | $901 | $71,978 | $10,666 | $61,312 |
| 2014 | $842 | $70,570 | $10,458 | $60,112 |
Source: Public Records
Map
Nearby Homes
- 209 S Belmont St
- 334 Albany St
- 609 Dover St
- 328 Dover Place
- 420 Dover Place
- 622 Dover St
- 432 Dover Place
- 718 Florito Way
- 607 Ellington St
- 406 Calle de La Vina
- 115 9th Ave
- 814 Encanto Way
- 125 Glenwood St
- 121 Glenwood St
- 339 Glenwood St
- 601 Glenwood St
- 613 Glenwood St
- 1010 Dover St
- 142 W 11th Place
- 146 W 11th Place