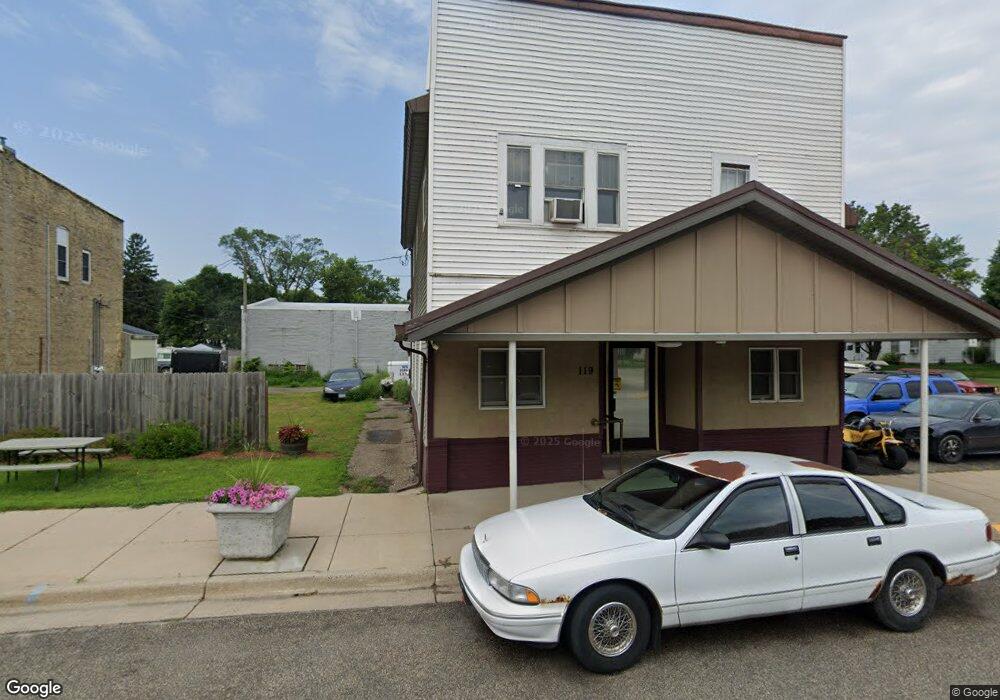
118 Division St N Morristown, MN 55052
Estimated Value: $119,000
--
Bed
--
Bath
1,020
Sq Ft
$117/Sq Ft
Est. Value
About This Home
This home is located at 118 Division St N, Morristown, MN 55052 and is currently priced at $119,000, approximately $116 per square foot. 118 Division St N is a home located in Rice County with nearby schools including Waterville Elementary School, Morristown Elementary School, and Waterville-Elysian-Morristown Junior High School.
Ownership History
Date
Name
Owned For
Owner Type
Purchase Details
Closed on
Aug 26, 2021
Sold by
Tonjum Jr Richard D and Tonjum Mary B
Bought by
Tonjum Investments Llc
Current Estimated Value
Purchase Details
Closed on
Jan 15, 2021
Sold by
Reliance Bank
Bought by
Tonjum Richard and Tonjum Mary
Home Financials for this Owner
Home Financials are based on the most recent Mortgage that was taken out on this home.
Original Mortgage
$60,000
Interest Rate
2.67%
Mortgage Type
Unknown
Purchase Details
Closed on
Feb 17, 2017
Sold by
Brooks Phillip D and Brooks Kimberly A
Bought by
Brooks Phillip D and Brooks Kimberly A
Home Financials for this Owner
Home Financials are based on the most recent Mortgage that was taken out on this home.
Original Mortgage
$102,549
Interest Rate
4.2%
Mortgage Type
Commercial
Purchase Details
Closed on
Jul 13, 2005
Sold by
Phillips Mark A and Phillips Nancy A
Bought by
Wilson Carroll
Create a Home Valuation Report for This Property
The Home Valuation Report is an in-depth analysis detailing your home's value as well as a comparison with similar homes in the area
Home Values in the Area
Average Home Value in this Area
Purchase History
| Date | Buyer | Sale Price | Title Company |
|---|---|---|---|
| Tonjum Investments Llc | $500 | None Listed On Document | |
| Tonjum Richard | $75,000 | None Available | |
| Brooks Phillip D | -- | Attorney | |
| Brooks Phillip D | $30,000 | Attorney | |
| Wilson Carroll | $25,000 | -- | |
| Tonjum Richard Richard | $75,000 | -- |
Source: Public Records
Mortgage History
| Date | Status | Borrower | Loan Amount |
|---|---|---|---|
| Previous Owner | Tonjum Richard | $60,000 | |
| Previous Owner | Brooks Phillip D | $102,549 | |
| Closed | Tonjum Richard Richard | $75,000 |
Source: Public Records
Tax History Compared to Growth
Tax History
| Year | Tax Paid | Tax Assessment Tax Assessment Total Assessment is a certain percentage of the fair market value that is determined by local assessors to be the total taxable value of land and additions on the property. | Land | Improvement |
|---|---|---|---|---|
| 2025 | $2,058 | $104,500 | $14,800 | $89,700 |
| 2024 | $2,058 | $84,500 | $9,100 | $75,400 |
| 2023 | $1,726 | $84,500 | $9,100 | $75,400 |
| 2022 | $1,634 | $79,300 | $8,600 | $70,700 |
| 2021 | $1,480 | $73,700 | $8,000 | $65,700 |
| 2020 | $1,188 | $66,400 | $8,000 | $58,400 |
| 2019 | $1,214 | $56,400 | $9,100 | $47,300 |
| 2018 | $940 | $55,500 | $9,100 | $46,400 |
| 2017 | $1,072 | $41,000 | $9,100 | $31,900 |
| 2016 | $608 | $41,000 | $9,100 | $31,900 |
| 2015 | $552 | $19,900 | $9,100 | $10,800 |
| 2014 | -- | $19,900 | $9,100 | $10,800 |
Source: Public Records
Map
Nearby Homes
- 206 W Main St
- 305 1st St NE
- 425 W Franklin St
- -XXX 260th St W
- TBD 260th St W
- 9295 270th St W
- TBD Kent Ave
- 11698 Morristown Blvd
- 23231 Farwell Ave
- Tbd 160th St
- 6255 232nd St W
- - Xxxx Falcon Way
- 6031 232nd St W
- 0 430th Ave
- 8325 Hennepin Way
- 10525 210th St W
- 5600 Cannon Lake Ct
- 13262 Sakatah Lake Rd
- TBD Geneva Ave
- 17001 Elmore Ave
- 119 Division St N
- 100 W Franklin St
- 102 W Franklin St
- 104 W Franklin St
- 104 104 Franklin-Street-w
- 103 W Franklin St
- 112 Division St N
- 106 Division St S
- 105 W Franklin St
- 105 105 Franklin-Street-w
- 21 E Franklin St
- 203 Division St N
- 108 W Franklin St
- 101 Main St W
- 107 W Franklin St
- 107 107 Franklin-Street-w
- 109 W Franklin St
- 109 109 Franklin-Street-w
- 23 E Main St
- 204 Division St S