Estimated Value: $143,000 - $228,000
Studio
--
Bath
2,352
Sq Ft
$76/Sq Ft
Est. Value
About This Home
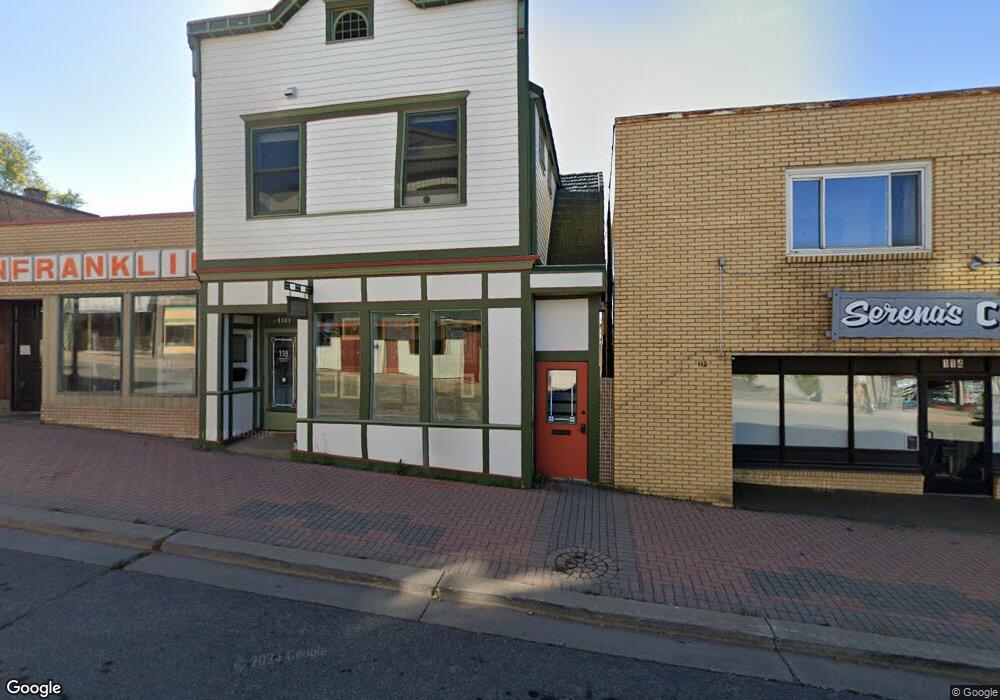
This home is located at 118 E Chapman St, Ely, MN 55731 and is currently estimated at $177,701, approximately $75 per square foot. 118 E Chapman St is a home located in St. Louis County with nearby schools including Washington Elementary School and Memorial High School.
Ownership History
Date
Name
Owned For
Owner Type
Purchase Details
Closed on
Jul 13, 2020
Sold by
Bowe John Edward and Bowe John E
Bought by
Music Lofts Llc
Current Estimated Value
Purchase Details
Closed on
Sep 30, 2011
Sold by
Boundary Waters Bank
Bought by
Bowe John E and Shepherd Rosemary F
Home Financials for this Owner
Home Financials are based on the most recent Mortgage that was taken out on this home.
Original Mortgage
$59,200
Interest Rate
4.11%
Mortgage Type
Seller Take Back
Purchase Details
Closed on
May 13, 2009
Sold by
Arcila Warren and Arcila Jennifer
Bought by
Boundary Waters Bank
Purchase Details
Closed on
Mar 15, 2006
Sold by
Smith Mary Ann
Bought by
Arcila Warren and Arcila Jennifer
Home Financials for this Owner
Home Financials are based on the most recent Mortgage that was taken out on this home.
Original Mortgage
$80,000
Interest Rate
6.39%
Mortgage Type
Purchase Money Mortgage
Create a Home Valuation Report for This Property
The Home Valuation Report is an in-depth analysis detailing your home's value as well as a comparison with similar homes in the area
Home Values in the Area
Average Home Value in this Area
Purchase History
| Date | Buyer | Sale Price | Title Company |
|---|---|---|---|
| Music Lofts Llc | -- | None Available | |
| Bowe John E | $74,000 | Ne Ely | |
| Boundary Waters Bank | $80,724 | None Available | |
| Arcila Warren | $90,000 | Ne Title |
Source: Public Records
Mortgage History
| Date | Status | Borrower | Loan Amount |
|---|---|---|---|
| Previous Owner | Bowe John E | $59,200 | |
| Previous Owner | Arcila Warren | $80,000 |
Source: Public Records
Tax History
| Year | Tax Paid | Tax Assessment Tax Assessment Total Assessment is a certain percentage of the fair market value that is determined by local assessors to be the total taxable value of land and additions on the property. | Land | Improvement |
|---|---|---|---|---|
| 2024 | $3,182 | $135,600 | $12,600 | $123,000 |
| 2023 | $3,182 | $134,400 | $12,600 | $121,800 |
| 2022 | $2,290 | $86,100 | $11,400 | $74,700 |
| 2021 | $2,472 | $86,100 | $11,400 | $74,700 |
| 2020 | $2,276 | $86,100 | $11,400 | $74,700 |
| 2019 | $2,026 | $86,100 | $11,400 | $74,700 |
| 2018 | $1,770 | $75,900 | $11,400 | $64,500 |
| 2017 | $2,164 | $69,500 | $14,100 | $55,400 |
| 2016 | $2,176 | $69,500 | $14,100 | $55,400 |
| 2015 | $2,266 | $72,200 | $16,600 | $55,600 |
| 2014 | $2,266 | $72,200 | $16,600 | $55,600 |
Source: Public Records
Map
Nearby Homes
- 27 E Harvey St
- 235 E Harvey St
- 23 W Harvey St
- 313 E Chapman St
- 324 S 4th Ave E
- 246 N 5th Ave E
- 628 E Sheridan St
- 52 W Chandler St
- 738 E Camp St
- 545 E Wilson St
- TBD Trezona Rd
- TBD Hill Top Rd
- 1471 N Pioneer Rd
- 2101 Sibley Ct
- 2221 Sibley Dr
- 2231 Sibley Dr
- 1530 N 20th Ave E
- TBD Johnson Creek Dr
- 1280 Heather St
- TBD N White Iron Rd
- 114 E Chapman St Unit ELY
- 130 E Chapman St Unit ELY
- 117 E Harvey St
- 131 E Harvey St
- 137 E Harvey St
- 133 E Harvey St
- 119 E Chapman St
- 119 E Chapman St Unit ELY
- 139 E Chapman St
- 103 E Chapman St
- 133 E Chapman St Unit ELY
- 143 E Harvey St
- 143 E Harvey St Unit 25 S. 2nd Avenue E.
- 25 E S 2nd Ave
- 141 E Chapman St
- 33 E Chapman St
- 31 E Harvey St
- 126 E Sheridan St
- 40 N 1st Ave E
- 120 E Harvey St
Your Personal Tour Guide
Ask me questions while you tour the home.