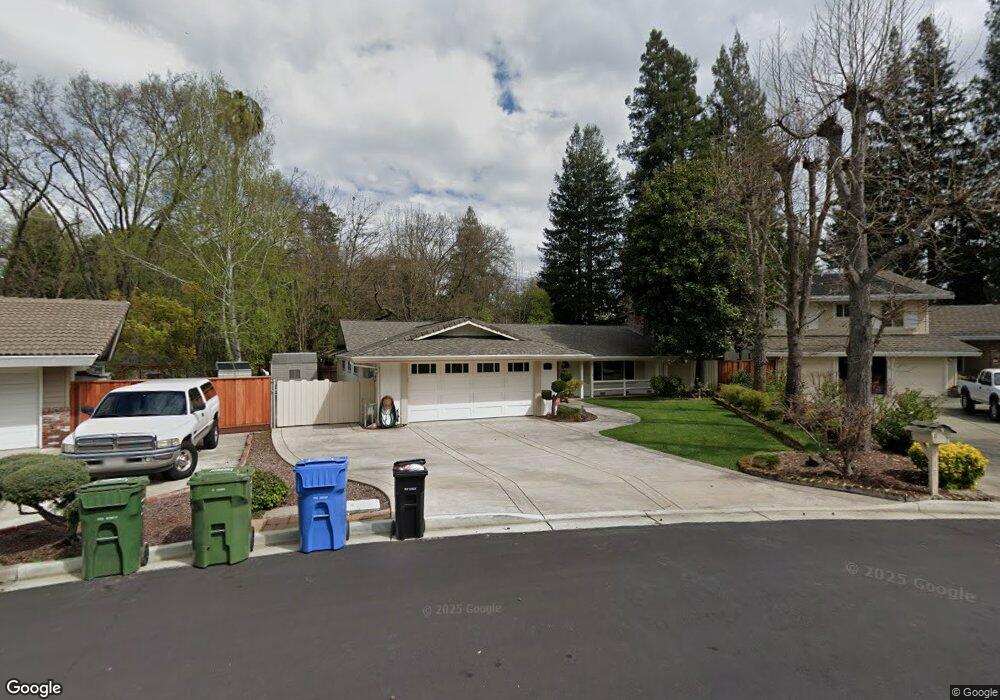
118 Glen Ct Danville, CA 94526
Downtown Danville NeighborhoodEstimated Value: $2,167,000 - $2,692,000
5
Beds
3
Baths
2,529
Sq Ft
$968/Sq Ft
Est. Value
About This Home
This home is located at 118 Glen Ct, Danville, CA 94526 and is currently estimated at $2,449,278, approximately $968 per square foot. 118 Glen Ct is a home located in Contra Costa County with nearby schools including Montair Elementary School, Stone Valley Middle School, and San Ramon Valley High School.
Ownership History
Date
Name
Owned For
Owner Type
Purchase Details
Closed on
Nov 4, 2016
Sold by
Velasco Jack R and Velasco Adela
Bought by
Velasco Jack R and Velasco Adela
Current Estimated Value
Purchase Details
Closed on
Nov 28, 1999
Sold by
Velasco Jack R and Velasco Adela
Bought by
Velasco Jack R and Velasco Adela
Purchase Details
Closed on
Oct 24, 1995
Sold by
Guerrero Henry S and Guerrero Elizabeth A
Bought by
Velasco Jack R and Velasco Adela
Home Financials for this Owner
Home Financials are based on the most recent Mortgage that was taken out on this home.
Original Mortgage
$240,000
Outstanding Balance
$1,668
Interest Rate
7.5%
Mortgage Type
Purchase Money Mortgage
Estimated Equity
$2,447,610
Purchase Details
Closed on
Nov 29, 1993
Sold by
Ortiz Miguel Angel and Ortiz Carol L
Bought by
Guerrero Henry S and Guerrero Elizabeth A
Home Financials for this Owner
Home Financials are based on the most recent Mortgage that was taken out on this home.
Original Mortgage
$257,600
Interest Rate
3.75%
Mortgage Type
Purchase Money Mortgage
Create a Home Valuation Report for This Property
The Home Valuation Report is an in-depth analysis detailing your home's value as well as a comparison with similar homes in the area
Home Values in the Area
Average Home Value in this Area
Purchase History
| Date | Buyer | Sale Price | Title Company |
|---|---|---|---|
| Velasco Jack R | -- | None Available | |
| Velasco Jack R | -- | -- | |
| Velasco Jack R | $22,000 | -- | |
| Velasco Jack R | $290,000 | First American Title Guarant | |
| Guerrero Henry S | $322,000 | Chicago Title Company |
Source: Public Records
Mortgage History
| Date | Status | Borrower | Loan Amount |
|---|---|---|---|
| Open | Velasco Jack R | $240,000 | |
| Previous Owner | Guerrero Henry S | $257,600 |
Source: Public Records
Tax History Compared to Growth
Tax History
| Year | Tax Paid | Tax Assessment Tax Assessment Total Assessment is a certain percentage of the fair market value that is determined by local assessors to be the total taxable value of land and additions on the property. | Land | Improvement |
|---|---|---|---|---|
| 2025 | $6,291 | $510,649 | $292,870 | $217,779 |
| 2024 | $6,260 | $500,637 | $287,128 | $213,509 |
| 2023 | $6,260 | $490,822 | $281,499 | $209,323 |
| 2022 | $6,214 | $481,199 | $275,980 | $205,219 |
| 2021 | $6,075 | $471,765 | $270,569 | $201,196 |
| 2019 | $5,926 | $457,774 | $262,545 | $195,229 |
| 2018 | $5,704 | $448,799 | $257,398 | $191,401 |
| 2017 | $5,492 | $440,000 | $252,351 | $187,649 |
| 2016 | $5,332 | $431,373 | $247,403 | $183,970 |
| 2015 | $5,252 | $424,894 | $243,687 | $181,207 |
| 2014 | $5,168 | $416,572 | $238,914 | $177,658 |
Source: Public Records
Map
Nearby Homes
- 823 La Gonda Way
- 230 El Pinto Unit A1
- 136 Garden Creek Place
- 35 Danville Oak Place
- 413 Shirlee Dr
- 775 Kirkcrest Rd
- 151 Camino Amigo Ct
- 517 La Gonda Way
- 853 El Pintado Rd
- 855 El Pintado Rd
- 123 Alamo Springs Dr
- 375 W El Pintado Unit 221
- 375 W El Pintado Unit 218
- 375 W El Pintado Unit 227
- 375 W El Pintado Unit 204
- 375 W El Pintado Unit 202
- 375 W El Pintado Unit 201
- 375 W El Pintado Unit 323
- Unit 309 Plan at The Nova
- Unit 317 Plan at The Nova