118 Lacy Rd Jaffrey, NH 03452
Estimated Value: $477,000 - $668,000
4
Beds
2
Baths
2,980
Sq Ft
$198/Sq Ft
Est. Value
About This Home
This home is located at 118 Lacy Rd, Jaffrey, NH 03452 and is currently estimated at $589,007, approximately $197 per square foot. 118 Lacy Rd is a home located in Cheshire County with nearby schools including Jaffrey Grade School, Conant Middle High School, and Conant High School.
Ownership History
Date
Name
Owned For
Owner Type
Purchase Details
Closed on
Dec 6, 2022
Sold by
Niemela Alvah W
Bought by
Alvah W Niemela Ret
Current Estimated Value
Purchase Details
Closed on
Aug 6, 2021
Sold by
Niemela Kyle S
Bought by
Kyle S Niemela Ret
Purchase Details
Closed on
Jul 14, 2020
Sold by
Porter Stephanie
Bought by
Niemela Kyle S
Purchase Details
Closed on
Jul 22, 2003
Sold by
Niemela Alvah W and Niemela Barbara J
Bought by
Niemela Kyle and Niemela Stephanie
Home Financials for this Owner
Home Financials are based on the most recent Mortgage that was taken out on this home.
Original Mortgage
$150,000
Interest Rate
5.34%
Create a Home Valuation Report for This Property
The Home Valuation Report is an in-depth analysis detailing your home's value as well as a comparison with similar homes in the area
Home Values in the Area
Average Home Value in this Area
Purchase History
| Date | Buyer | Sale Price | Title Company |
|---|---|---|---|
| Alvah W Niemela Ret | -- | None Available | |
| Kyle S Niemela Ret | -- | None Available | |
| Kyle S Niemela Ret | -- | None Available | |
| Niemela Kyle S | -- | None Available | |
| Niemela Kyle S | -- | None Available | |
| Niemela Kyle | $200,000 | -- |
Source: Public Records
Mortgage History
| Date | Status | Borrower | Loan Amount |
|---|---|---|---|
| Previous Owner | Niemela Kyle | $150,000 |
Source: Public Records
Tax History
| Year | Tax Paid | Tax Assessment Tax Assessment Total Assessment is a certain percentage of the fair market value that is determined by local assessors to be the total taxable value of land and additions on the property. | Land | Improvement |
|---|---|---|---|---|
| 2024 | $11,234 | $342,500 | $62,100 | $280,400 |
| 2023 | $11,422 | $342,500 | $62,100 | $280,400 |
| 2022 | $10,611 | $342,500 | $62,100 | $280,400 |
| 2021 | $9,552 | $342,500 | $62,100 | $280,400 |
| 2020 | $9,429 | $342,500 | $62,100 | $280,400 |
| 2019 | $9,265 | $266,000 | $48,100 | $217,900 |
| 2018 | $8,778 | $266,000 | $48,100 | $217,900 |
| 2017 | $8,770 | $266,000 | $48,100 | $217,900 |
| 2016 | $8,778 | $266,000 | $48,100 | $217,900 |
Source: Public Records
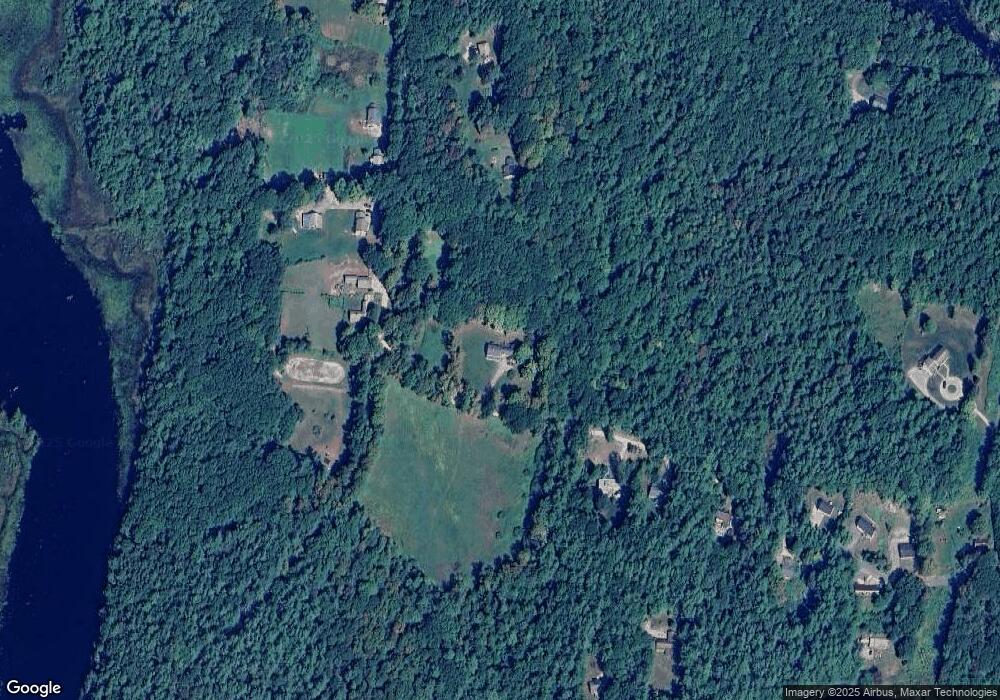
Map
Nearby Homes
- 61 Gilmore Pond Rd
- 8 Charlonne St
- 29 Hathorn Rd
- 31 North St
- 8 Cross St
- 236 Main St
- 129 Scenic Dr
- 179 Scenic Dr
- 13 Harkness Rd
- 18 Roberts Dr Unit 1
- 65 Roberts Dr Unit 17
- 57 Roberts Dr Unit 19
- 122 Proctor Rd
- 199 Bryant Rd
- 94 Fitch Rd
- 10-2 Ingalls Rd
- 98 Perry Rd
- 52 Roberts Dr Unit 5
- 40 Roberts Dr Unit 3
- 56 Roberts Dr Unit 7
Your Personal Tour Guide
Ask me questions while you tour the home.