Estimated Value: $147,000 - $167,368
2
Beds
2
Baths
1,380
Sq Ft
$114/Sq Ft
Est. Value
About This Home
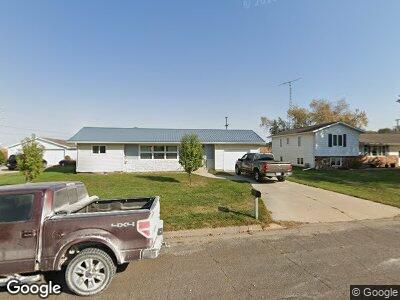
This home is located at 118 Lyndale St N, Mabel, MN 55954 and is currently estimated at $156,842, approximately $113 per square foot. 118 Lyndale St N is a home located in Fillmore County with nearby schools including Mabel-Canton Elementary School and Mabel-Canton Secondary School.
Ownership History
Date
Name
Owned For
Owner Type
Purchase Details
Closed on
Sep 29, 2022
Sold by
Mcgarvey Bonnie and Mcgarvey Patrick
Bought by
Sorum Dean
Current Estimated Value
Home Financials for this Owner
Home Financials are based on the most recent Mortgage that was taken out on this home.
Original Mortgage
$165,000
Outstanding Balance
$159,256
Interest Rate
5.13%
Mortgage Type
New Conventional
Estimated Equity
-$2,414
Purchase Details
Closed on
Jul 28, 2017
Sold by
Holland Charles
Bought by
Mcgarvey Patrick J and Mcgarvey Bonnie L
Home Financials for this Owner
Home Financials are based on the most recent Mortgage that was taken out on this home.
Original Mortgage
$52,000
Interest Rate
3.88%
Mortgage Type
Purchase Money Mortgage
Purchase Details
Closed on
Jan 3, 2011
Sold by
Austin Helen M
Bought by
Austin Lamont
Purchase Details
Closed on
Apr 22, 2005
Sold by
Torgerson Roland M and Torgerson Cdell
Bought by
Ranzenberger Marlene
Create a Home Valuation Report for This Property
The Home Valuation Report is an in-depth analysis detailing your home's value as well as a comparison with similar homes in the area
Home Values in the Area
Average Home Value in this Area
Purchase History
| Date | Buyer | Sale Price | Title Company |
|---|---|---|---|
| Sorum Dean | $165,000 | -- | |
| Mcgarvey Patrick J | $65,000 | None Available | |
| Austin Lamont | $52,000 | None Available | |
| Ranzenberger Marlene | $78,000 | None Available |
Source: Public Records
Mortgage History
| Date | Status | Borrower | Loan Amount |
|---|---|---|---|
| Open | Sorum Dean | $165,000 | |
| Previous Owner | Mcgarvey Patrick J | $52,000 |
Source: Public Records
Tax History Compared to Growth
Tax History
| Year | Tax Paid | Tax Assessment Tax Assessment Total Assessment is a certain percentage of the fair market value that is determined by local assessors to be the total taxable value of land and additions on the property. | Land | Improvement |
|---|---|---|---|---|
| 2024 | $2,014 | $145,900 | $20,000 | $125,900 |
| 2023 | $2,296 | $145,900 | $20,000 | $125,900 |
| 2022 | $2,296 | $119,400 | $22,500 | $96,900 |
| 2021 | $2,296 | $110,000 | $13,100 | $96,900 |
| 2020 | $1,992 | $110,000 | $13,100 | $96,900 |
| 2019 | $1,928 | $87,800 | $13,100 | $74,700 |
| 2018 | $1,386 | $87,800 | $13,100 | $74,700 |
| 2017 | -- | $87,900 | $13,100 | $74,800 |
| 2016 | $1,324 | $77,400 | $13,100 | $64,300 |
| 2015 | $1,498 | $54,100 | $8,457 | $45,643 |
| 2014 | $1,498 | $45,300 | $7,860 | $37,440 |
| 2013 | $1,498 | $63,900 | $9,020 | $54,880 |
Source: Public Records
Map
Nearby Homes
- 227 S Robert St
- 107 Karli Dr
- 237 S Robert St
- 241 S Robert St
- TBD County 8
- 1537 360th St
- 11040 Dove Rd
- 11089 Dove Rd
- 3495 Bear Creek Rd
- 122 3rd Ave SW
- 104 2nd Ave SW
- 148 2nd Ave SE
- 136 2nd Ave SE
- 39601 County 18
- 13824 371st Ave
- 17251 E Pine Dr NW
- 12549 County 21
- 118 Quandahl Rd
- 16011 Guberud Hill Dr
- 3000 S Old Mill Rd