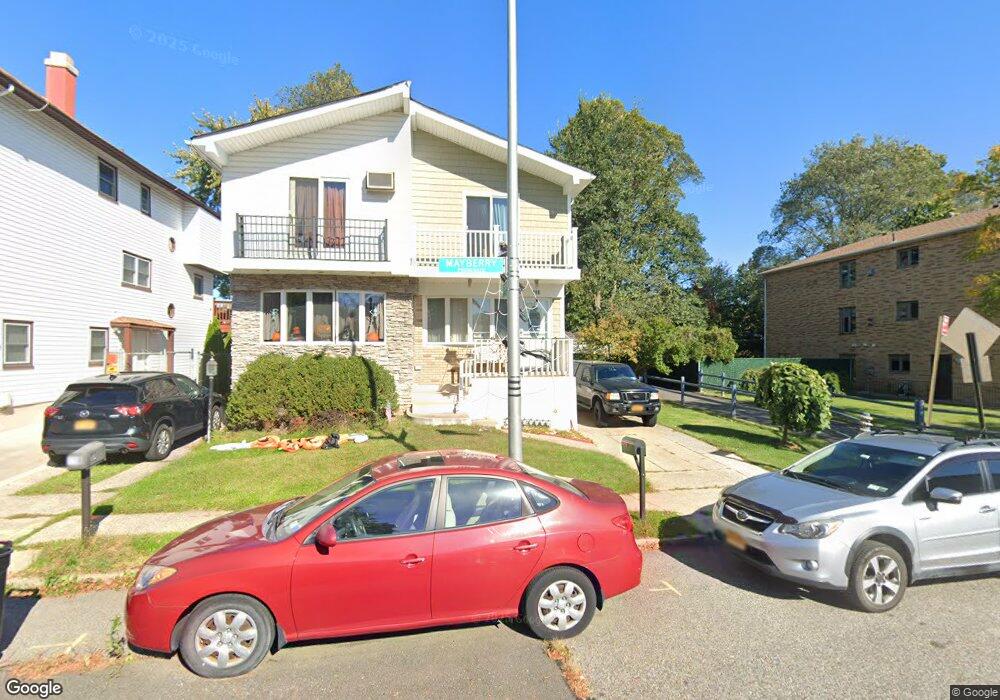
118 Mayberry Promenade Staten Island, NY 10312
Eltingville NeighborhoodEstimated Value: $658,000 - $736,000
3
Beds
2
Baths
1,404
Sq Ft
$490/Sq Ft
Est. Value
About This Home
This home is located at 118 Mayberry Promenade, Staten Island, NY 10312 and is currently estimated at $688,539, approximately $490 per square foot. 118 Mayberry Promenade is a home located in Richmond County with nearby schools including P.S. 55 The Henry M. Boehm School, I.S. 007 Elias Bernstein, and Tottenville High School.
Ownership History
Date
Name
Owned For
Owner Type
Purchase Details
Closed on
Aug 19, 2009
Sold by
Litton Loan Servicing Lp
Bought by
Leggio Paul and Leggio Katherine
Current Estimated Value
Home Financials for this Owner
Home Financials are based on the most recent Mortgage that was taken out on this home.
Original Mortgage
$371,387
Outstanding Balance
$241,652
Interest Rate
5.17%
Mortgage Type
FHA
Estimated Equity
$446,887
Purchase Details
Closed on
Sep 29, 2006
Sold by
Tsaplina Yuliya
Bought by
Roberts Patricia
Home Financials for this Owner
Home Financials are based on the most recent Mortgage that was taken out on this home.
Original Mortgage
$339,200
Interest Rate
8.24%
Mortgage Type
Purchase Money Mortgage
Purchase Details
Closed on
Jul 6, 1998
Sold by
Tsaplin Vladimir and Tsaplina Yuliya
Bought by
Tsaplina Yuliya
Purchase Details
Closed on
Jun 5, 1997
Sold by
Perretta Louis A and Perretta Constance Mayer
Bought by
Tsaplin Vladimir and Tsaplina Yuliya
Create a Home Valuation Report for This Property
The Home Valuation Report is an in-depth analysis detailing your home's value as well as a comparison with similar homes in the area
Home Values in the Area
Average Home Value in this Area
Purchase History
| Date | Buyer | Sale Price | Title Company |
|---|---|---|---|
| Leggio Paul | $342,732 | First American Title Ins Co | |
| Roberts Patricia | $424,000 | None Available | |
| Tsaplina Yuliya | -- | Chicago Title Insurance Co | |
| Tsaplin Vladimir | $175,000 | Stewart Title Insurance Co |
Source: Public Records
Mortgage History
| Date | Status | Borrower | Loan Amount |
|---|---|---|---|
| Open | Leggio Paul | $371,387 | |
| Previous Owner | Roberts Patricia | $339,200 |
Source: Public Records
Tax History Compared to Growth
Tax History
| Year | Tax Paid | Tax Assessment Tax Assessment Total Assessment is a certain percentage of the fair market value that is determined by local assessors to be the total taxable value of land and additions on the property. | Land | Improvement |
|---|---|---|---|---|
| 2025 | $6,316 | $42,240 | $6,238 | $36,002 |
| 2024 | $6,328 | $39,540 | $6,529 | $33,011 |
| 2023 | $6,008 | $30,985 | $5,891 | $25,094 |
| 2022 | $5,549 | $33,900 | $7,860 | $26,040 |
| 2021 | $5,849 | $32,160 | $7,860 | $24,300 |
| 2020 | $5,617 | $32,340 | $7,860 | $24,480 |
| 2019 | $5,433 | $33,180 | $7,860 | $25,320 |
| 2018 | $4,966 | $25,821 | $6,820 | $19,001 |
| 2017 | $4,666 | $24,360 | $7,860 | $16,500 |
| 2016 | $4,623 | $24,676 | $7,733 | $16,943 |
| 2015 | $4,163 | $23,280 | $7,560 | $15,720 |
| 2014 | $4,163 | $23,280 | $7,560 | $15,720 |
Source: Public Records
Map
Nearby Homes
- 40 Wakefield Rd
- 488 King St
- 27 Mayberry Promenade
- 467 King St
- 97 Kinghorn St
- 155 Bathgate St
- 69 Elmbank St
- 439 Retford Ave
- 15 Lenzie St
- 415 King St
- 192 Bathgate St
- 4396 Hylan Blvd
- 324 Retford Ave
- 440 Harold Ave
- 533 Tennyson Dr
- 422 Harold Ave
- 4262 Richmond Ave
- 145 Shirley Ave
- 41 Bennett Place
- 267 Woods of Arden Rd
- 116 Mayberry Promenade
- 114 Mayberry Promenade
- 112 Mayberry Promenade
- 132 Mayberry Promenade
- 108 Mayberry Promenade
- 106 Mayberry Promenade
- 0 Wakefield Rd Unit 981814
- 0 Wakefield Rd Unit 991932
- 0 Wakefield Rd Unit 991933
- 0 Wakefield Rd Unit 1115934
- 104 Mayberry Promenade
- 136 Mayberry Promenade
- 4 Strawberry Ln
- 7 Strawberry Ln
- 6 Strawberry Ln
- 102 Mayberry Promenade
- 9 Strawberry Ln
- 7 Wakefield Rd
- 142 Mayberry Promenade
- 10 Strawberry Ln