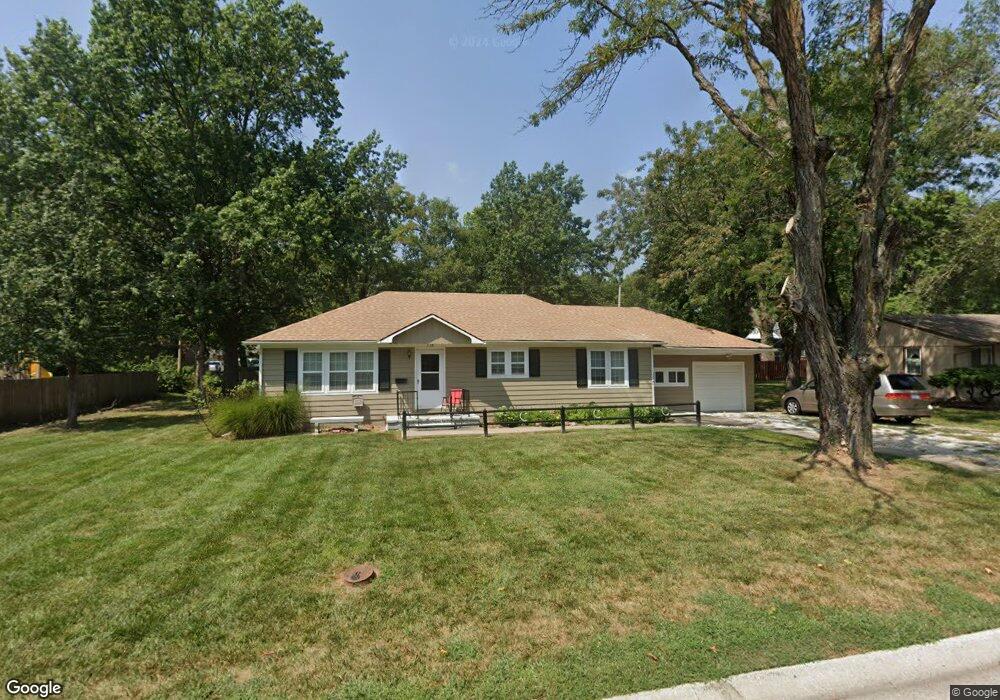
118 N Walnut St Gardner, KS 66030
Gardner-Edgerton NeighborhoodEstimated Value: $237,000 - $274,000
2
Beds
1
Bath
1,196
Sq Ft
$210/Sq Ft
Est. Value
About This Home
This home is located at 118 N Walnut St, Gardner, KS 66030 and is currently estimated at $251,282, approximately $210 per square foot. 118 N Walnut St is a home located in Johnson County with nearby schools including Madison Elementary School, Pioneer Ridge Middle School, and Gardner Edgerton High School.
Ownership History
Date
Name
Owned For
Owner Type
Purchase Details
Closed on
Mar 24, 2023
Sold by
Anderson Carolyn Rae
Bought by
Anderson Richard Brian and Anderson Robert Michael
Current Estimated Value
Purchase Details
Closed on
Jul 24, 2015
Sold by
Nelsen Philio A and Anderson Nelsen Carolyn R
Bought by
Anderson Nelsen Carolyn R
Purchase Details
Closed on
Oct 14, 2008
Sold by
Strack Jeffrey E and Strack Michelle
Bought by
Nelsen Philip A and Anderson Carolyn R
Purchase Details
Closed on
Jan 26, 2006
Sold by
Strack Gary E and Strack Janet M
Bought by
Strack Jeffrey E
Home Financials for this Owner
Home Financials are based on the most recent Mortgage that was taken out on this home.
Original Mortgage
$94,000
Interest Rate
6.18%
Mortgage Type
New Conventional
Purchase Details
Closed on
Aug 22, 2005
Sold by
Peer Raymond C and Mckarnin Patricia E
Bought by
Strack Gary E and Strack Janet M
Create a Home Valuation Report for This Property
The Home Valuation Report is an in-depth analysis detailing your home's value as well as a comparison with similar homes in the area
Home Values in the Area
Average Home Value in this Area
Purchase History
| Date | Buyer | Sale Price | Title Company |
|---|---|---|---|
| Anderson Richard Brian | -- | -- | |
| Anderson Nelsen Carolyn R | $50,000 | None Available | |
| Nelsen Philip A | -- | Midwest Title Co Inc | |
| Nelsen Philip A | -- | Midwest Title Company Inc | |
| Strack Jeffrey E | -- | Kansas Title Insurance Corp | |
| Strack Gary E | -- | None Available |
Source: Public Records
Mortgage History
| Date | Status | Borrower | Loan Amount |
|---|---|---|---|
| Previous Owner | Strack Jeffrey E | $94,000 |
Source: Public Records
Tax History Compared to Growth
Tax History
| Year | Tax Paid | Tax Assessment Tax Assessment Total Assessment is a certain percentage of the fair market value that is determined by local assessors to be the total taxable value of land and additions on the property. | Land | Improvement |
|---|---|---|---|---|
| 2024 | $3,297 | $27,301 | $5,024 | $22,277 |
| 2023 | $3,181 | $25,473 | $4,183 | $21,290 |
| 2022 | $2,997 | $23,736 | $3,488 | $20,248 |
| 2021 | $2,685 | $20,332 | $2,793 | $17,539 |
| 2020 | $2,619 | $19,377 | $2,793 | $16,584 |
| 2019 | $2,338 | $17,583 | $2,793 | $14,790 |
| 2018 | $2,248 | $16,571 | $2,546 | $14,025 |
| 2017 | $1,884 | $14,053 | $2,546 | $11,507 |
| 2016 | $1,734 | $12,868 | $2,546 | $10,322 |
| 2015 | $1,621 | $12,236 | $2,546 | $9,690 |
| 2013 | -- | $11,247 | $2,546 | $8,701 |
Source: Public Records
Map
Nearby Homes
- 124 N Pine St
- 314 W Main St
- 123 Meadowbrook Dr
- 306 W Jefferson St
- 321 N Pine St
- 183rd 56 Hwy
- 545 W Washington St
- 14728 Four Corners Rd
- 341 N Hickory St
- 417 N Locust St
- 736 W Shawnee Ct
- 741 W Shawnee Ct
- 417 N Hickory St
- 329 S Center St
- 509 N Persimmon St
- 517 N Persimmon St
- 525 N Persimmon St
- 197 W Colleen Ct
- 543 W Lanesfield St
- 533 N Persimmon St
- 112 N Walnut St
- 124 N Walnut St
- 117 N Pine St
- 125 N Pine St
- 113 N Pine St
- 230 W Shawnee St
- 115 N Walnut St
- 104 N Walnut St
- 130 N Walnut St
- 131 N Pine St
- 131 N Walnut St
- 228 W Main St
- 224 W Shawnee St
- 112 N Pine St
- 223 W Shawnee St
- 227 W Washington St
- 224 W Main St
- 106 N Pine St
- 130 N Pine St
- 216 W Shawnee St