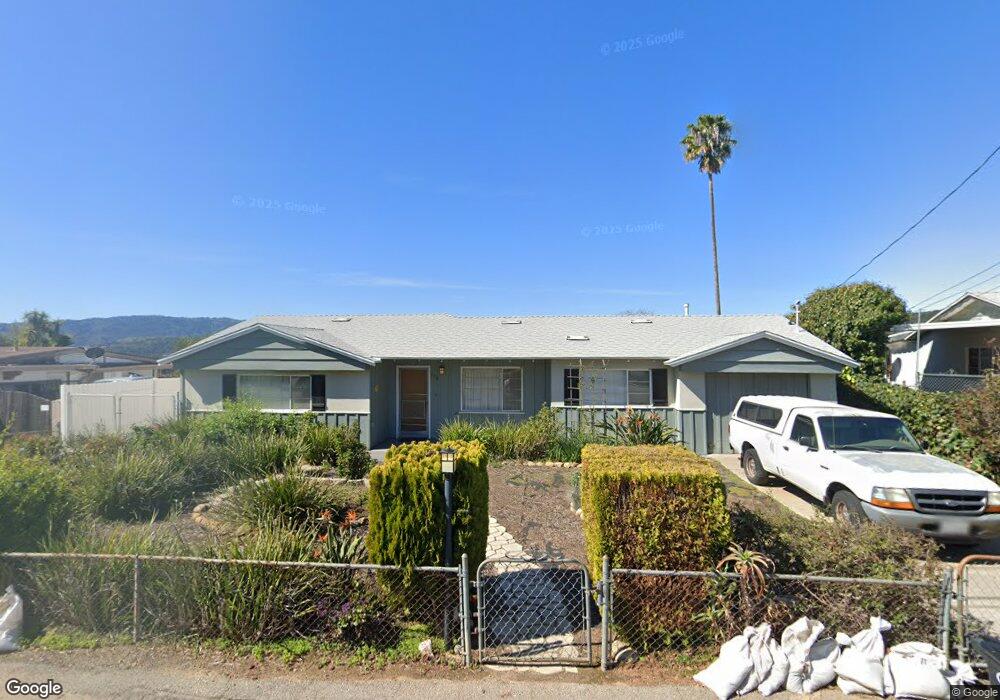
118 Puesta Del Sol Oak View, CA 93022
Estimated Value: $849,965 - $1,367,000
3
Beds
2
Baths
1,089
Sq Ft
$1,039/Sq Ft
Est. Value
About This Home
This home is located at 118 Puesta Del Sol, Oak View, CA 93022 and is currently estimated at $1,130,991, approximately $1,038 per square foot. 118 Puesta Del Sol is a home located in Ventura County with nearby schools including Mira Monte Elementary School, Meiners Oaks Elementary School, and Matilija Junior High.
Ownership History
Date
Name
Owned For
Owner Type
Purchase Details
Closed on
Aug 15, 2025
Sold by
Melendez Oscar and Melendez Gloria
Bought by
Oscar Melendez And Gloria Melendez Living Tru and Melendez
Current Estimated Value
Purchase Details
Closed on
Jan 22, 2009
Sold by
Melendez Oscar and Melendez Gloria
Bought by
Melendez Oscar and Melendez Gloria
Home Financials for this Owner
Home Financials are based on the most recent Mortgage that was taken out on this home.
Original Mortgage
$215,000
Interest Rate
4.68%
Mortgage Type
New Conventional
Purchase Details
Closed on
Jun 14, 2006
Sold by
Melendez Oscar and Melendez Gloria
Bought by
Melendez Oscar and Melendez Gloria
Purchase Details
Closed on
Jul 20, 1994
Sold by
American Commercial Bank
Bought by
Ventura County Flood Control District
Create a Home Valuation Report for This Property
The Home Valuation Report is an in-depth analysis detailing your home's value as well as a comparison with similar homes in the area
Home Values in the Area
Average Home Value in this Area
Purchase History
| Date | Buyer | Sale Price | Title Company |
|---|---|---|---|
| Oscar Melendez And Gloria Melendez Living Tru | -- | None Listed On Document | |
| Melendez Oscar | -- | Accommodation | |
| Melendez Oscar | -- | Fidelity National Title Co | |
| Melendez Oscar | -- | None Available | |
| Ventura County Flood Control District | -- | -- |
Source: Public Records
Mortgage History
| Date | Status | Borrower | Loan Amount |
|---|---|---|---|
| Previous Owner | Melendez Oscar | $215,000 |
Source: Public Records
Tax History
| Year | Tax Paid | Tax Assessment Tax Assessment Total Assessment is a certain percentage of the fair market value that is determined by local assessors to be the total taxable value of land and additions on the property. | Land | Improvement |
|---|---|---|---|---|
| 2025 | $1,711 | $87,400 | $19,555 | $67,845 |
| 2024 | $1,711 | $85,687 | $19,172 | $66,515 |
| 2023 | $1,646 | $84,007 | $18,796 | $65,211 |
| 2022 | $1,643 | $82,360 | $18,427 | $63,933 |
| 2021 | $1,629 | $80,746 | $18,066 | $62,680 |
| 2020 | $1,591 | $79,921 | $17,882 | $62,039 |
| 2019 | $1,548 | $78,355 | $17,532 | $60,823 |
| 2018 | $1,523 | $76,820 | $17,189 | $59,631 |
| 2017 | $1,505 | $75,314 | $16,852 | $58,462 |
| 2016 | $1,491 | $73,838 | $16,522 | $57,316 |
| 2015 | $1,471 | $72,731 | $16,275 | $56,456 |
| 2014 | $1,421 | $71,308 | $15,957 | $55,351 |
Source: Public Records
Map
Nearby Homes
- 65 Calle Vista Del Monte
- 10980 N Ventura Ave
- 11146 N Ventura Ave
- 265 Encino Dr
- 10945 Alto Ct
- 0 2 Burnham Rd
- 10995 Alto Ct
- 1176 N Ventura Ave
- 1157 Woodland Ave
- 350 Riverside Rd
- 401 Burnham Rd
- 950 Woodland Ave Unit 26
- 358 Sunset Ct
- 33 Monterey Dr
- 848 Woodland Ave Unit 24
- 10681 Encino Dr
- 11755 Mirror Lake Ave
- 130 Olive St
- 10505 Dale Ave
- 75 Maxine Ave
- 102 Puesta Del Sol
- 136 Puesta Del Sol
- 96 Puesta Del Sol
- 154 Puesta Del Sol
- 29 Calle Cinco de Mayo
- 91 Puesta Del Sol
- 84 Puesta Del Sol
- 185 Puesta Del Sol
- 172 Puesta Del Sol
- 28 Calle Cinco de Mayo
- 43 Calle Cinco de Mayo
- 32 Barbara St
- 62 Puesta Del Sol
- 198 Puesta Del Sol
- 36 Calle Cinco de Mayo
- 67 Calle Cinco de Mayo
- 5 Calle Vista Del Monte
- 58 Barbara St
- 58 Calle Cinco de Mayo
- 210 Puesta Del Sol
Your Personal Tour Guide
Ask me questions while you tour the home.