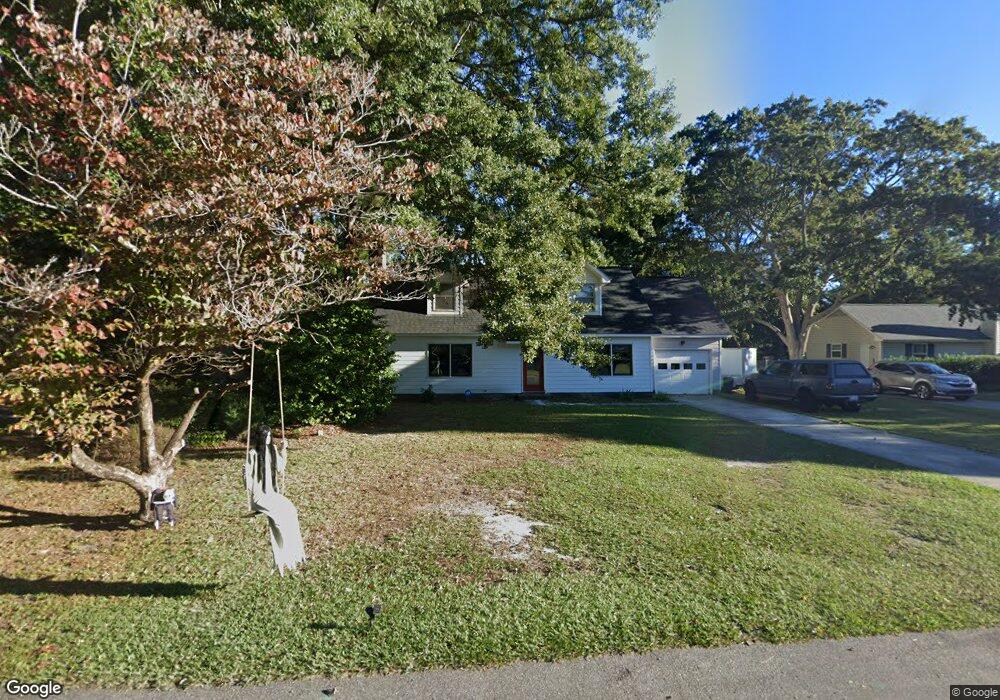
118 Red Fox Rd Wilmington, NC 28409
Lansdowne NeighborhoodEstimated Value: $362,000 - $401,000
3
Beds
2
Baths
1,560
Sq Ft
$247/Sq Ft
Est. Value
About This Home
This home is located at 118 Red Fox Rd, Wilmington, NC 28409 and is currently estimated at $385,654, approximately $247 per square foot. 118 Red Fox Rd is a home located in New Hanover County with nearby schools including Masonboro Elementary School, Myrtle Grove Middle School, and John T. Hoggard High School.
Ownership History
Date
Name
Owned For
Owner Type
Purchase Details
Closed on
Jun 7, 2006
Sold by
Shackelford Linda Leist and Pollei Mary E
Bought by
Stagaard Erin
Current Estimated Value
Home Financials for this Owner
Home Financials are based on the most recent Mortgage that was taken out on this home.
Original Mortgage
$140,000
Outstanding Balance
$81,545
Interest Rate
6.5%
Mortgage Type
Fannie Mae Freddie Mac
Estimated Equity
$304,109
Purchase Details
Closed on
Feb 17, 2006
Sold by
Shackelford Randy Lynn
Bought by
Shackelford Linda Leist
Purchase Details
Closed on
Dec 30, 1992
Sold by
Dalton James C Tonya J
Bought by
Shackelford Randy L Linda
Purchase Details
Closed on
Jun 1, 1981
Sold by
Gerstenhaber Larry Laura
Bought by
Dalton James C Tonya J
Purchase Details
Closed on
Dec 1, 1980
Sold by
Suggs and Harrelson Const
Bought by
Gerstenhaber Larry Laura
Purchase Details
Closed on
Feb 1, 1971
Bought by
Suggs and Harrelson Const
Create a Home Valuation Report for This Property
The Home Valuation Report is an in-depth analysis detailing your home's value as well as a comparison with similar homes in the area
Home Values in the Area
Average Home Value in this Area
Purchase History
| Date | Buyer | Sale Price | Title Company |
|---|---|---|---|
| Stagaard Erin | $175,000 | None Available | |
| Shackelford Linda Leist | -- | None Available | |
| Shackelford Randy L Linda | -- | -- | |
| Shackelford Randy L Linda | $74,000 | -- | |
| Dalton James C Tonya J | $53,500 | -- | |
| Gerstenhaber Larry Laura | $50,500 | -- | |
| Suggs | -- | -- |
Source: Public Records
Mortgage History
| Date | Status | Borrower | Loan Amount |
|---|---|---|---|
| Open | Stagaard Erin | $140,000 | |
| Closed | Stagaard Erin | $35,000 |
Source: Public Records
Tax History Compared to Growth
Tax History
| Year | Tax Paid | Tax Assessment Tax Assessment Total Assessment is a certain percentage of the fair market value that is determined by local assessors to be the total taxable value of land and additions on the property. | Land | Improvement |
|---|---|---|---|---|
| 2025 | $2,157 | $366,600 | $136,100 | $230,500 |
| 2023 | $2,012 | $231,300 | $88,000 | $143,300 |
| 2022 | $1,966 | $231,300 | $88,000 | $143,300 |
| 2021 | $1,979 | $231,300 | $88,000 | $143,300 |
| 2020 | $1,891 | $179,500 | $55,000 | $124,500 |
| 2019 | $1,891 | $179,500 | $55,000 | $124,500 |
| 2018 | $1,891 | $179,500 | $55,000 | $124,500 |
| 2017 | $1,891 | $179,500 | $55,000 | $124,500 |
| 2016 | $1,627 | $146,800 | $49,500 | $97,300 |
| 2015 | $1,555 | $146,800 | $49,500 | $97,300 |
| 2014 | $1,489 | $146,800 | $49,500 | $97,300 |
Source: Public Records
Map
Nearby Homes
- 302 N Hampton Rd
- 5029 Monck Ct
- 124 Kelly Rd
- 3403 Kildare Place
- 116 Kelly Rd
- 3239 Kellerton Place
- 6711 Hardscrabble Ct
- 3720 Mason Port Dr Unit 60
- 3166 Painted Turtle Loop
- 1129 Davis Sound Ln
- 3164 Painted Turtle Loop Unit 6
- 3164 Painted Turtle Loop
- 3160 Painted Turtle Loop Unit 7
- 3146 Painted Turtle Loop
- 3325 Amber Dr
- 110 Cabbage Inlet Ln
- 3513 Saint Francis Dr
- 3927 Watersail Dr
- 3927 Watersail Dr Unit 93
- 3805 Mason Port Dr