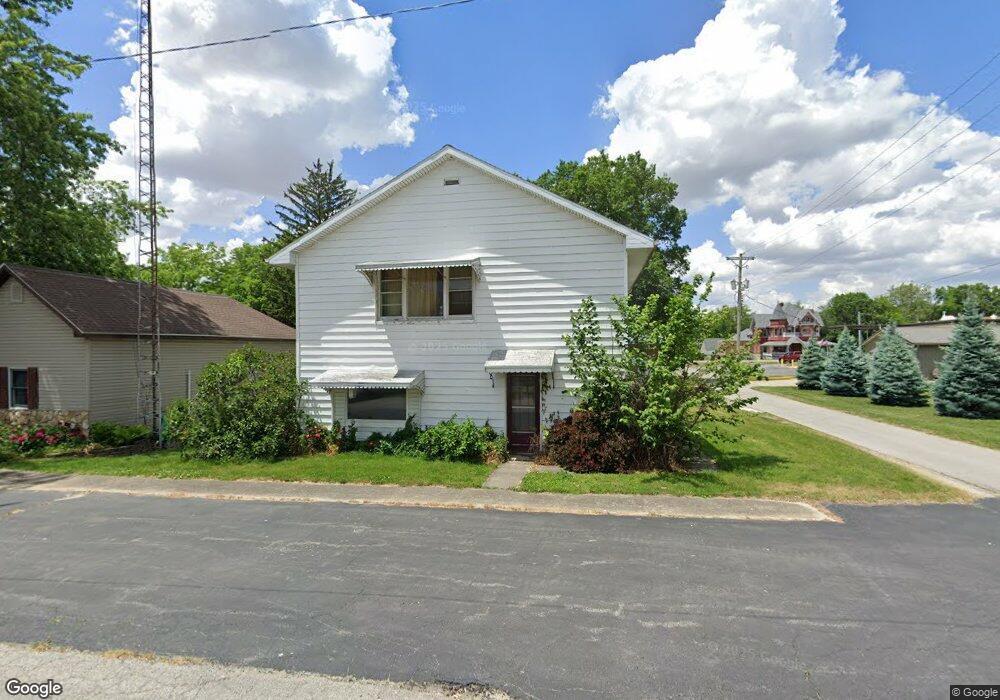
118 S Main St Warren, IN 46792
Estimated Value: $49,000 - $234,000
3
Beds
3
Baths
3,016
Sq Ft
$51/Sq Ft
Est. Value
About This Home
This home is located at 118 S Main St, Warren, IN 46792 and is currently estimated at $154,618, approximately $51 per square foot. 118 S Main St is a home located in Huntington County with nearby schools including Salamonie School and Huntington North High School.
Ownership History
Date
Name
Owned For
Owner Type
Purchase Details
Closed on
Jan 24, 2025
Sold by
Cheney Cynthia
Bought by
Bolinger Property Management Llc
Current Estimated Value
Purchase Details
Closed on
Aug 9, 2023
Sold by
Ledbetter Debra
Bought by
Cheney Cynthia and Scheib David C
Purchase Details
Closed on
Jul 8, 2015
Sold by
Kaye Louanne
Bought by
Ledbetter Debra
Purchase Details
Closed on
Jul 2, 2015
Sold by
Buckley Shannon
Bought by
Kaye Louanne
Purchase Details
Closed on
Mar 1, 1996
Sold by
Wendell S Thompson
Bought by
Louanne Kaye
Create a Home Valuation Report for This Property
The Home Valuation Report is an in-depth analysis detailing your home's value as well as a comparison with similar homes in the area
Home Values in the Area
Average Home Value in this Area
Purchase History
| Date | Buyer | Sale Price | Title Company |
|---|---|---|---|
| Bolinger Property Management Llc | $45,000 | None Listed On Document | |
| Cheney Cynthia | -- | None Listed On Document | |
| Ledbetter Debra | -- | None Available | |
| Kaye Louanne | -- | None Available | |
| Louanne Kaye | $78,000 | Matheny Michael Hahn & Denman |
Source: Public Records
Tax History Compared to Growth
Tax History
| Year | Tax Paid | Tax Assessment Tax Assessment Total Assessment is a certain percentage of the fair market value that is determined by local assessors to be the total taxable value of land and additions on the property. | Land | Improvement |
|---|---|---|---|---|
| 2024 | $512 | $151,400 | $11,600 | $139,800 |
| 2023 | $1,253 | $126,700 | $11,600 | $115,100 |
| 2022 | $1,141 | $114,100 | $11,600 | $102,500 |
| 2021 | $1,049 | $104,900 | $11,600 | $93,300 |
| 2020 | $1,105 | $110,500 | $11,600 | $98,900 |
| 2019 | $1,093 | $94,300 | $11,600 | $82,700 |
| 2018 | $1,049 | $89,400 | $11,600 | $77,800 |
| 2017 | $1,014 | $88,800 | $11,600 | $77,200 |
| 2016 | $628 | $88,000 | $11,600 | $76,400 |
| 2014 | $253 | $84,900 | $11,600 | $73,300 |
| 2013 | $253 | $81,800 | $11,600 | $70,200 |
Source: Public Records
Map
Nearby Homes