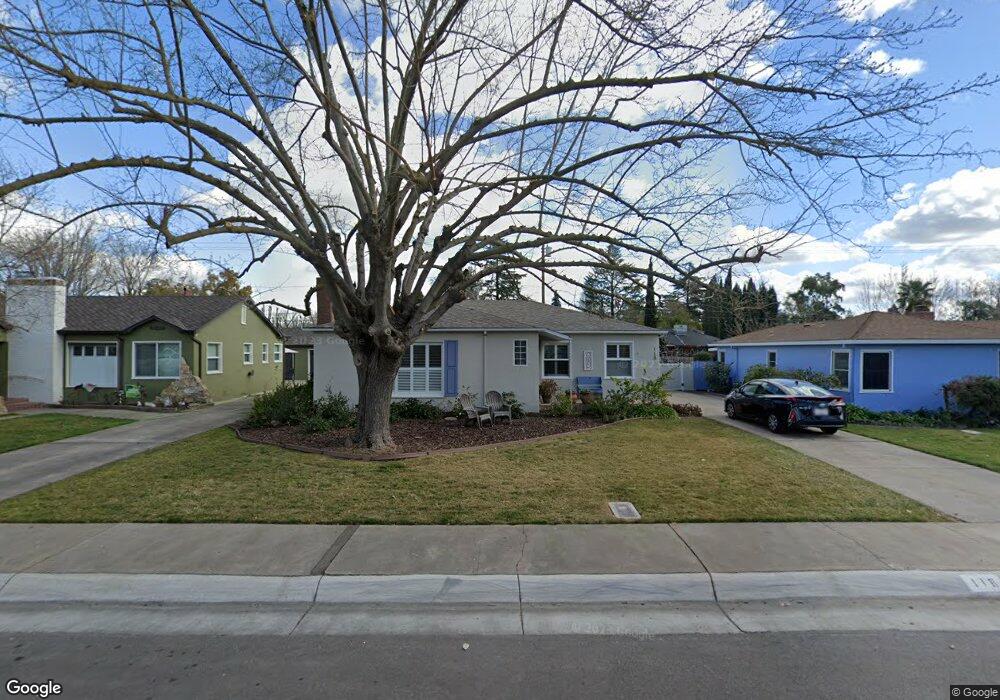
118 S Sunset Dr Lodi, CA 95240
Downtown Lodi NeighborhoodEstimated Value: $516,903 - $545,000
3
Beds
2
Baths
1,430
Sq Ft
$369/Sq Ft
Est. Value
About This Home
This home is located at 118 S Sunset Dr, Lodi, CA 95240 and is currently estimated at $527,476, approximately $368 per square foot. 118 S Sunset Dr is a home located in San Joaquin County with nearby schools including George Washington Elementary School, Millswood Middle School, and Lodi High School.
Ownership History
Date
Name
Owned For
Owner Type
Purchase Details
Closed on
Nov 18, 2019
Sold by
Mellor Nancy Ahlberg
Bought by
Mellor Nancy Ahlberg and Mellor Family Trust
Current Estimated Value
Purchase Details
Closed on
Feb 11, 2008
Sold by
Joy Shirley T and The Charles Turner Joy Jr Revo
Bought by
Mellor Reed I and Mellor Nancy Ahlberg
Home Financials for this Owner
Home Financials are based on the most recent Mortgage that was taken out on this home.
Original Mortgage
$280,000
Outstanding Balance
$176,431
Interest Rate
6.04%
Mortgage Type
Purchase Money Mortgage
Estimated Equity
$351,045
Purchase Details
Closed on
Aug 4, 2003
Sold by
Whitted Christopher and Whitted Stacey
Bought by
Joy Charles Turner and Joy Shirley T
Purchase Details
Closed on
Mar 21, 1996
Sold by
Woodrome Wiley B and Woodrome Karen L
Bought by
Whitted Christopher and Breakfield Stacey
Home Financials for this Owner
Home Financials are based on the most recent Mortgage that was taken out on this home.
Original Mortgage
$119,121
Interest Rate
6.98%
Mortgage Type
FHA
Create a Home Valuation Report for This Property
The Home Valuation Report is an in-depth analysis detailing your home's value as well as a comparison with similar homes in the area
Home Values in the Area
Average Home Value in this Area
Purchase History
| Date | Buyer | Sale Price | Title Company |
|---|---|---|---|
| Mellor Nancy Ahlberg | -- | None Available | |
| Mellor Reed I | $350,000 | Placer Title Company | |
| Joy Charles Turner | $275,000 | Old Republic Title Co | |
| Whitted Christopher | $120,000 | Old Republic Title Company |
Source: Public Records
Mortgage History
| Date | Status | Borrower | Loan Amount |
|---|---|---|---|
| Open | Mellor Reed I | $280,000 | |
| Previous Owner | Whitted Christopher | $119,121 |
Source: Public Records
Tax History Compared to Growth
Tax History
| Year | Tax Paid | Tax Assessment Tax Assessment Total Assessment is a certain percentage of the fair market value that is determined by local assessors to be the total taxable value of land and additions on the property. | Land | Improvement |
|---|---|---|---|---|
| 2025 | $4,992 | $459,713 | $137,914 | $321,799 |
| 2024 | $4,856 | $450,700 | $135,210 | $315,490 |
| 2023 | $4,791 | $441,863 | $132,559 | $309,304 |
| 2022 | $4,685 | $433,200 | $129,960 | $303,240 |
| 2021 | $4,270 | $380,000 | $130,000 | $250,000 |
| 2020 | $3,821 | $345,500 | $120,000 | $225,500 |
| 2019 | $3,819 | $345,500 | $120,000 | $225,500 |
| 2018 | $3,736 | $336,000 | $101,000 | $235,000 |
| 2017 | $3,725 | $336,000 | $101,000 | $235,000 |
| 2016 | $3,255 | $307,000 | $92,000 | $215,000 |
| 2014 | $2,458 | $229,000 | $69,000 | $160,000 |
Source: Public Records
Map
Nearby Homes
- 619 W Elm St
- 400 N Fairmont Ave
- 430 S Crescent Ave
- 380 S Sunset Dr
- 400 N Pacific Ave
- 431 W Elm St
- 725 Costa Dr
- 1421 Graffigna Ave
- 607 S Crescent Ave
- 912 Tara Place
- 542 Sturla St
- 1818 Capell Dr
- 19 N Pinewood Ct
- 648 Daisy Ave
- 411 W Locust St
- 2001 Jerry Ln
- 852 Daisy Ave
- 800 Cheney Ct
- 306 Shady Acres Dr
- 613 S Lee Ave
- 124 S Sunset Dr
- 112 S Sunset Dr
- 115 S Fairmont Ave
- 128 S Sunset Dr
- 106 S Sunset Dr
- 123 S Fairmont Ave
- 109 S Fairmont Ave
- 117 S Sunset Dr
- 129 S Fairmont Ave
- 123 S Sunset Dr
- 111 S Sunset Dr
- 132 S Sunset Dr
- 101 S Fairmont Ave
- 127 S Sunset Dr
- 105 S Sunset Dr
- 135 S Fairmont Ave
- 138 S Sunset Dr
- 131 S Sunset Dr
- 1200 W Oak St
- 116 S Ham Ln