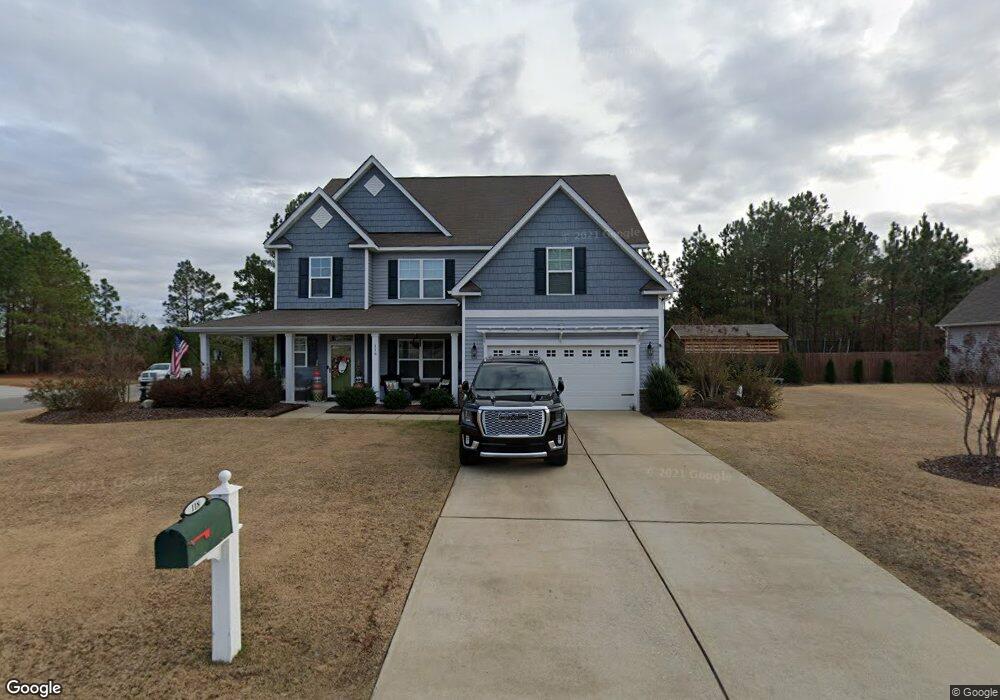
118 Sandy Springs (Lot 54) Rd Aberdeen, NC 28315
Estimated Value: $512,000 - $590,244
4
Beds
3
Baths
3,210
Sq Ft
$170/Sq Ft
Est. Value
About This Home
This home is located at 118 Sandy Springs (Lot 54) Rd, Aberdeen, NC 28315 and is currently estimated at $547,061, approximately $170 per square foot. 118 Sandy Springs (Lot 54) Rd is a home located in Moore County with nearby schools including Highland Oaks Elementary School, Aberdeen Elementary School, and Southern Middle School.
Ownership History
Date
Name
Owned For
Owner Type
Purchase Details
Closed on
Feb 28, 2022
Sold by
Smith Reggie A and Smith Keshia M
Bought by
Longueil Jean-Paul
Current Estimated Value
Purchase Details
Closed on
Sep 22, 2016
Sold by
Wilson Craig D and Wilson Heather L
Bought by
Smith Reggie A and Smith Keshia M
Home Financials for this Owner
Home Financials are based on the most recent Mortgage that was taken out on this home.
Original Mortgage
$264,618
Interest Rate
3.5%
Mortgage Type
FHA
Purchase Details
Closed on
Dec 17, 2013
Sold by
Savvy Homes Llc
Bought by
Wilson Craig D and Wilson Heather L
Home Financials for this Owner
Home Financials are based on the most recent Mortgage that was taken out on this home.
Original Mortgage
$239,381
Interest Rate
4.19%
Mortgage Type
VA
Create a Home Valuation Report for This Property
The Home Valuation Report is an in-depth analysis detailing your home's value as well as a comparison with similar homes in the area
Home Values in the Area
Average Home Value in this Area
Purchase History
| Date | Buyer | Sale Price | Title Company |
|---|---|---|---|
| Longueil Jean-Paul | $500,000 | Van Camp Meacham & Newman Pllc | |
| Smith Reggie A | $269,500 | Attorney | |
| Wilson Craig D | -- | Attorney | |
| Wilson Craig D | $252,000 | None Available |
Source: Public Records
Mortgage History
| Date | Status | Borrower | Loan Amount |
|---|---|---|---|
| Previous Owner | Smith Reggie A | $264,618 | |
| Previous Owner | Wilson Craig D | $239,381 |
Source: Public Records
Tax History Compared to Growth
Tax History
| Year | Tax Paid | Tax Assessment Tax Assessment Total Assessment is a certain percentage of the fair market value that is determined by local assessors to be the total taxable value of land and additions on the property. | Land | Improvement |
|---|---|---|---|---|
| 2024 | $3,664 | $477,430 | $45,000 | $432,430 |
| 2023 | $3,760 | $477,430 | $45,000 | $432,430 |
| 2022 | $3,243 | $319,540 | $30,000 | $289,540 |
| 2021 | $3,323 | $319,540 | $30,000 | $289,540 |
| 2020 | $3,337 | $299,970 | $30,000 | $269,970 |
| 2019 | $3,150 | $317,840 | $30,000 | $287,840 |
| 2018 | $2,441 | $250,310 | $25,000 | $225,310 |
| 2017 | $2,415 | $250,310 | $25,000 | $225,310 |
| 2015 | $2,290 | $250,310 | $25,000 | $225,310 |
| 2014 | $2,726 | $297,950 | $42,500 | $255,450 |
| 2013 | -- | $297,950 | $42,500 | $255,450 |
Source: Public Records
Map
Nearby Homes
- 602 Crepe Myrtle Ct
- 579 Midsummer St Unit 209
- Joyner Plan at Sandy Springs - Espree Series
- Bowen Plan at Sandy Springs - Espree Series
- Metcalf Plan at Sandy Springs - Espree Series
- McKimmon Plan at Sandy Springs - Heritage Series
- Watauga Plan at Sandy Springs - Heritage Series
- Turlington Plan at Sandy Springs - Espree Series
- Tucker Plan at Sandy Springs - Heritage Series
- Alexander Plan at Sandy Springs - Espree Series
- Winslow Plan at Sandy Springs - Espree Series
- 709 Foggy Crossing Ct
- 819 Cold Creek Rd Unit 248
- 120 Blyther St
- 113 Chisholm St
- 133 Hatley St
- 104 James St
- 1224 Pee Dee Rd
- 241 Hight Rd
- 10892 N Carolina 211
- 118 Sandy Springs Rd
- 155 Caulfield Rd
- 116 Sandy Springs Rd
- 116 Sandy Springs (Lot 53) Rd
- 119 Sandy Springs (Lot 56) Rd
- 54 Walkabout Dr
- 159 Caufield Rd
- 111 Caulfield Rd
- 114 Sandy Springs Rd
- 114 Sandy Springs (Lot 52) Rd
- 108 Caulfield Rd
- 170 Caufield Rd
- 109 Caulfield Rd
- 142 Caulfield Rd
- 146 Caulfield Rd
- 154 Caulfield Rd
- 158 Caulfield Rd
- 115 Sandy Springs Rd
- 115 Sandy Springs (Lot 55) Rd
- 126 Sandy Springs Rd