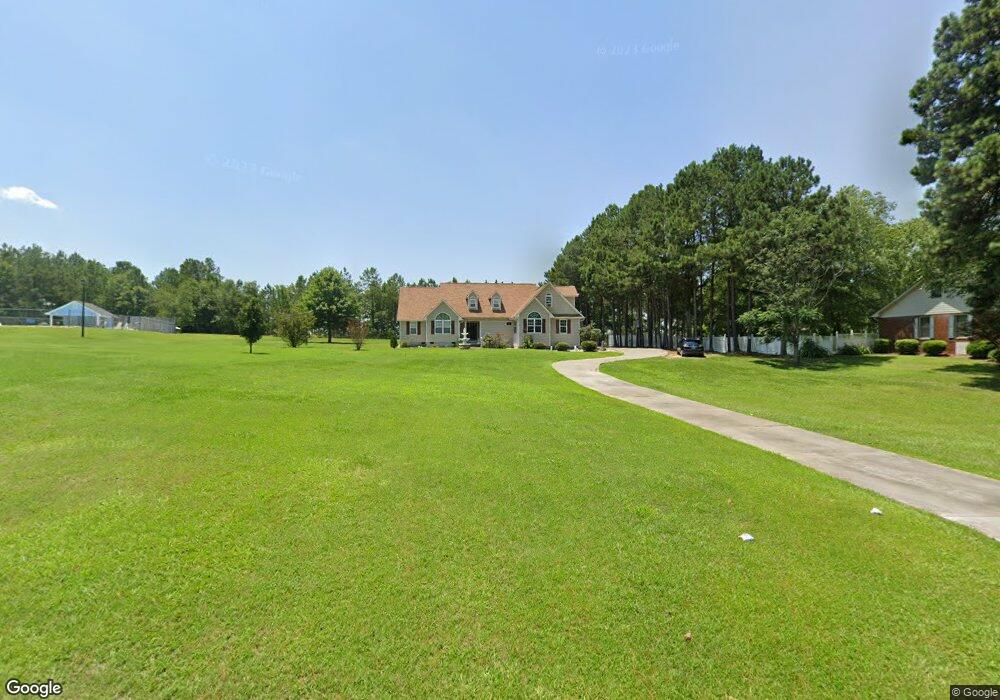
118 Timberland Dr Cordele, GA 31015
Estimated Value: $238,000 - $389,000
5
Beds
3
Baths
2,402
Sq Ft
$131/Sq Ft
Est. Value
About This Home
This home is located at 118 Timberland Dr, Cordele, GA 31015 and is currently estimated at $315,255, approximately $131 per square foot. 118 Timberland Dr is a home located in Crisp County with nearby schools including Crisp County Elementary School, Crisp County Primary School, and Crisp County Middle School.
Ownership History
Date
Name
Owned For
Owner Type
Purchase Details
Closed on
Sep 5, 2024
Sold by
Singh Davinder
Bought by
Johal Balvinder Singh
Current Estimated Value
Purchase Details
Closed on
Sep 2, 2021
Sold by
Singh David
Bought by
Singh Davinder and Johal Balvinder Singh
Purchase Details
Closed on
Jun 8, 2011
Sold by
A Home For Every Heart Llc
Bought by
Singh Davinder
Home Financials for this Owner
Home Financials are based on the most recent Mortgage that was taken out on this home.
Original Mortgage
$172,710
Interest Rate
5.5%
Mortgage Type
FHA
Purchase Details
Closed on
Nov 2, 2010
Sold by
Peaslee John M and Peaslee Ilinda M
Bought by
A Home For Every Heart Llc
Purchase Details
Closed on
Jun 27, 2003
Sold by
Floyd J W
Bought by
Peaslee John M and Peaslee Ilinda M
Create a Home Valuation Report for This Property
The Home Valuation Report is an in-depth analysis detailing your home's value as well as a comparison with similar homes in the area
Home Values in the Area
Average Home Value in this Area
Purchase History
| Date | Buyer | Sale Price | Title Company |
|---|---|---|---|
| Johal Balvinder Singh | $197,630 | -- | |
| Singh Davinder | -- | -- | |
| Singh Davinder | $180,000 | -- | |
| A Home For Every Heart Llc | $124,900 | -- | |
| A Home For Every Heart Llc | $124,904 | -- | |
| Peaslee John M | $2,000 | -- | |
| Floyd J W | -- | -- |
Source: Public Records
Mortgage History
| Date | Status | Borrower | Loan Amount |
|---|---|---|---|
| Previous Owner | Singh Davinder | $172,710 |
Source: Public Records
Tax History Compared to Growth
Tax History
| Year | Tax Paid | Tax Assessment Tax Assessment Total Assessment is a certain percentage of the fair market value that is determined by local assessors to be the total taxable value of land and additions on the property. | Land | Improvement |
|---|---|---|---|---|
| 2024 | $2,431 | $89,799 | $6,000 | $83,799 |
| 2023 | $2,433 | $86,624 | $6,000 | $80,624 |
| 2022 | $2,418 | $86,108 | $6,000 | $80,108 |
| 2021 | $2,296 | $77,441 | $6,000 | $71,441 |
| 2020 | $2,300 | $77,441 | $6,000 | $71,441 |
| 2019 | $2,285 | $77,441 | $6,000 | $71,441 |
| 2018 | $2,577 | $84,142 | $8,000 | $76,142 |
| 2017 | $2,519 | $81,919 | $8,000 | $73,919 |
| 2016 | $2,516 | $81,919 | $8,000 | $73,919 |
| 2015 | -- | $81,919 | $8,000 | $73,919 |
| 2014 | -- | $81,919 | $8,000 | $73,919 |
| 2013 | -- | $81,919 | $8,000 | $73,919 |
Source: Public Records
Map
Nearby Homes
- 114 Timberland Dr
- Lot #1 Timberland Dr
- 109 Timberland Dr
- 0 Timberland Dr
- 207 Timberland Dr
- 500 Timberland Dr
- 605 Timberland Dr
- 101 Oakatee Ct
- 113 Timberland Dr
- 206 Timberland Dr
- 110 Timberland Dr
- 0 Oakatee Ct
- 111 Timberland Dr
- 603 Timberland Dr
- 102 Oakatee Ct
- 105 Oakatee Ct
- 108 Timberland Dr
- 298 Timberland Dr
- 102 To Be Added
- 601 Timberland Dr