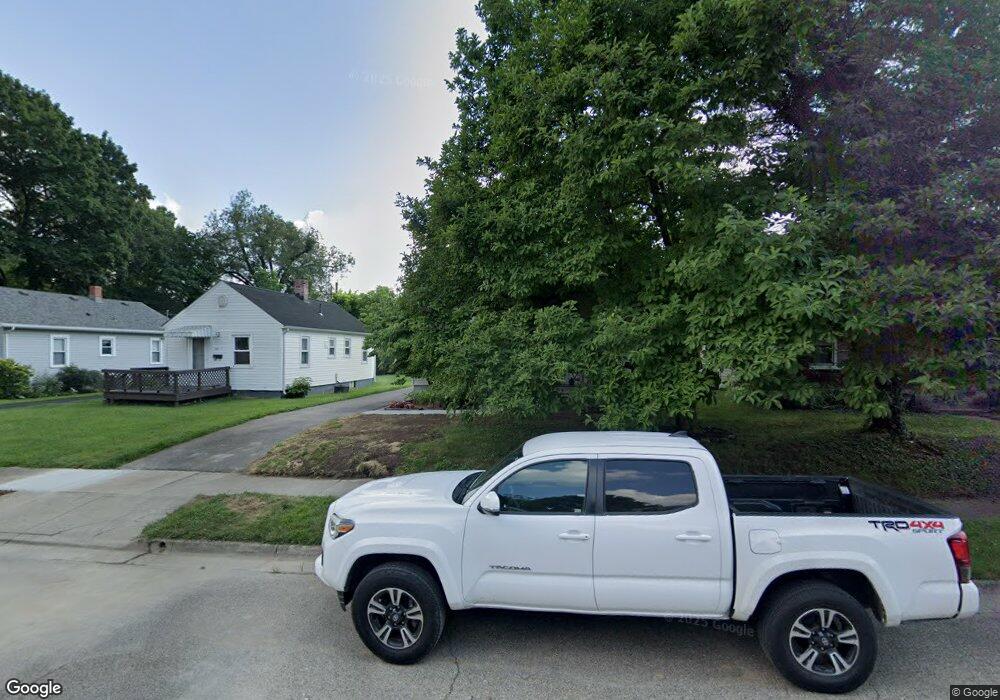
118 W Bryant Ave Franklin, OH 45005
Estimated Value: $162,211 - $180,000
2
Beds
1
Bath
1,108
Sq Ft
$158/Sq Ft
Est. Value
About This Home
This home is located at 118 W Bryant Ave, Franklin, OH 45005 and is currently estimated at $174,803, approximately $157 per square foot. 118 W Bryant Ave is a home located in Warren County with nearby schools including Franklin High School.
Ownership History
Date
Name
Owned For
Owner Type
Purchase Details
Closed on
May 29, 2021
Sold by
Ricks Diann J and Ricks Adam Diann
Bought by
Ricks Diann J and Ricks Robert P
Current Estimated Value
Purchase Details
Closed on
Aug 15, 2003
Sold by
Wavle Mark A and Wavle Christine R
Bought by
Adams Diann J
Home Financials for this Owner
Home Financials are based on the most recent Mortgage that was taken out on this home.
Original Mortgage
$110,761
Outstanding Balance
$48,775
Interest Rate
5.62%
Mortgage Type
FHA
Estimated Equity
$126,028
Purchase Details
Closed on
Oct 11, 2000
Sold by
Sickels Jennifer A
Bought by
Wavle Mark A
Home Financials for this Owner
Home Financials are based on the most recent Mortgage that was taken out on this home.
Original Mortgage
$91,743
Interest Rate
8.03%
Mortgage Type
FHA
Purchase Details
Closed on
Jun 2, 1998
Sold by
Retherford Rhoda A
Bought by
Sickels Jennifer A and Sickels Christopher T
Home Financials for this Owner
Home Financials are based on the most recent Mortgage that was taken out on this home.
Original Mortgage
$81,135
Interest Rate
7.27%
Mortgage Type
FHA
Purchase Details
Closed on
Jun 16, 1983
Sold by
Bussard Frederick E and Bussard Frederick E
Bought by
Bussard and Bussard Rhoda A
Create a Home Valuation Report for This Property
The Home Valuation Report is an in-depth analysis detailing your home's value as well as a comparison with similar homes in the area
Home Values in the Area
Average Home Value in this Area
Purchase History
| Date | Buyer | Sale Price | Title Company |
|---|---|---|---|
| Ricks Diann J | -- | None Available | |
| Adams Diann J | $112,433 | Landamerica | |
| Wavle Mark A | $92,500 | -- | |
| Sickels Jennifer A | $81,200 | -- | |
| Bussard | -- | -- |
Source: Public Records
Mortgage History
| Date | Status | Borrower | Loan Amount |
|---|---|---|---|
| Open | Adams Diann J | $110,761 | |
| Previous Owner | Wavle Mark A | $91,743 | |
| Previous Owner | Sickels Jennifer A | $81,135 |
Source: Public Records
Tax History Compared to Growth
Tax History
| Year | Tax Paid | Tax Assessment Tax Assessment Total Assessment is a certain percentage of the fair market value that is determined by local assessors to be the total taxable value of land and additions on the property. | Land | Improvement |
|---|---|---|---|---|
| 2024 | $2,589 | $47,070 | $9,010 | $38,060 |
| 2023 | $2,091 | $36,277 | $5,110 | $31,167 |
| 2022 | $2,055 | $36,278 | $5,110 | $31,168 |
| 2021 | $1,958 | $36,278 | $5,110 | $31,168 |
| 2020 | $1,780 | $28,788 | $4,053 | $24,735 |
| 2019 | $1,636 | $28,788 | $4,053 | $24,735 |
| 2018 | $1,428 | $28,788 | $4,053 | $24,735 |
| 2017 | $1,687 | $27,209 | $3,892 | $23,317 |
| 2016 | $1,716 | $27,209 | $3,892 | $23,317 |
| 2015 | $1,716 | $27,209 | $3,892 | $23,317 |
| 2014 | $1,547 | $27,210 | $3,890 | $23,320 |
| 2013 | $1,328 | $31,470 | $4,500 | $26,970 |
Source: Public Records
Map
Nearby Homes
- 315 Bridge St
- 228 Bridge St
- 102 Warren Ave
- 121 Boys Ave
- 0 Victoria Dr Unit 942075
- 0 Victoria Dr Unit 1852824
- 42 N River St
- 413 Spring Ave
- 605 Spring Ave
- 1012 Gribble Dr
- 209 Rossman Ct
- 324 Cris Ct
- 212 Rossman Ct
- 410 Park Ave
- 56 Skokiaan Dr
- 551 E 2nd St
- 509 Forest Ave
- 511 Forest Ave
- 728 Park Ave
- 730 Park Ave
- 114 W Bryant Ave
- 120 W Bryant Ave
- 112 W Bryant Ave
- 232 Bridge St
- 110 W Bryant Ave
- 212 Bridge St Unit B
- 212 Bridge St Unit E
- 108 W Bryant Ave
- 123 W Bryant Ave
- 125 W Bryant Ave
- 121 W Bryant Ave
- 317 Bridge St
- 321 Bridge St
- 231 Maxwell St Unit A
- 231 Maxwell St
- 129 W Bryant Ave
- 119 W Bryant Ave
- 325 Bridge St
- 222 Bridge St
- 104 W Bryant Ave