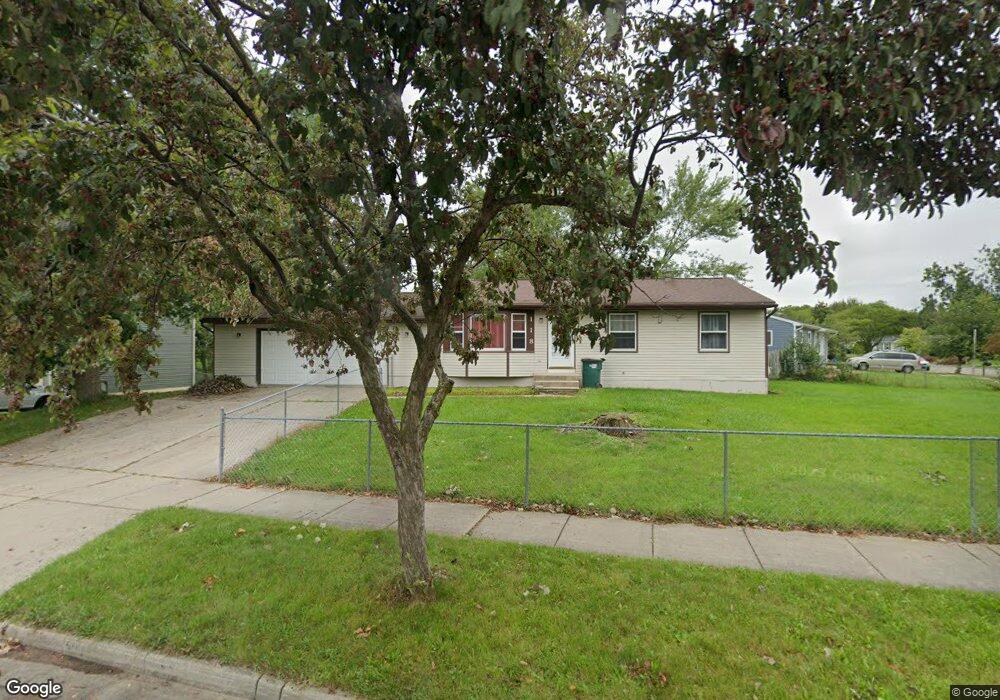
118 W Claremore Dr Lansing, MI 48911
Southern Lansing NeighborhoodEstimated Value: $176,395 - $212,000
--
Bed
1
Bath
989
Sq Ft
$195/Sq Ft
Est. Value
About This Home
This home is located at 118 W Claremore Dr, Lansing, MI 48911 and is currently estimated at $193,349, approximately $195 per square foot. 118 W Claremore Dr is a home located in Ingham County with nearby schools including Kendon School, Attwood School, and Everett High School.
Ownership History
Date
Name
Owned For
Owner Type
Purchase Details
Closed on
Aug 27, 2010
Sold by
Robinson Ann D
Bought by
Robinson Ann D and Schafer Michele Lea
Current Estimated Value
Purchase Details
Closed on
Aug 12, 2010
Sold by
Schafer Christopher and Robinson Ann
Bought by
Robinson Ann D
Purchase Details
Closed on
Oct 23, 2006
Sold by
Robinson Ann D and Robinson Allen C
Bought by
Robinson Ann D and Schafer Christopher Stephan
Create a Home Valuation Report for This Property
The Home Valuation Report is an in-depth analysis detailing your home's value as well as a comparison with similar homes in the area
Home Values in the Area
Average Home Value in this Area
Purchase History
| Date | Buyer | Sale Price | Title Company |
|---|---|---|---|
| Robinson Ann D | -- | None Available | |
| Robinson Ann D | -- | None Available | |
| Robinson Ann D | -- | First American Title Ins Co |
Source: Public Records
Tax History Compared to Growth
Tax History
| Year | Tax Paid | Tax Assessment Tax Assessment Total Assessment is a certain percentage of the fair market value that is determined by local assessors to be the total taxable value of land and additions on the property. | Land | Improvement |
|---|---|---|---|---|
| 2025 | $3,180 | $86,600 | $14,500 | $72,100 |
| 2024 | $25 | $75,900 | $14,500 | $61,400 |
| 2023 | $2,982 | $72,000 | $14,500 | $57,500 |
| 2022 | $2,687 | $61,900 | $12,700 | $49,200 |
| 2021 | $2,632 | $58,400 | $11,300 | $47,100 |
| 2020 | $2,616 | $54,900 | $11,300 | $43,600 |
| 2019 | $2,507 | $49,700 | $11,300 | $38,400 |
| 2018 | $2,350 | $48,700 | $11,300 | $37,400 |
| 2017 | $2,249 | $48,700 | $11,300 | $37,400 |
| 2016 | $2,151 | $42,700 | $11,300 | $31,400 |
| 2015 | $2,151 | $39,200 | $22,518 | $16,682 |
| 2014 | $2,151 | $38,200 | $26,150 | $12,050 |
Source: Public Records
Map
Nearby Homes
- 218 Raritan Rd
- 5727 Annapolis Dr
- 5730 Laporte Dr
- 6029 Ellendale Dr
- 5636 Ellendale Dr
- 5902 Hilliard Rd
- 208 E Northrup St
- 129 Village Dr
- 6246 Gardenia Ave
- 5751 Joshua St
- 6429 Rosedale Rd
- 6001 Joshua St
- 5808 Orchard Ct
- 5750 Orchard Ct
- 5724 Orchard Ct
- 6444 Sommerset Rd
- 6270 S Washington Ave
- 1020 R G Curtiss Ave
- 6421 S Washington Ave
- 1014 W Northrup St
- 5836 Annapolis Dr
- 124 W Claremore Dr
- 5830 Annapolis Dr
- 119 W Claremore Dr
- 200 W Claremore Dr
- 201 Tinley Dr
- 125 W Claremore Dr
- 5820 Annapolis Dr
- 112 W Claremore Dr
- 5910 Annapolis Dr
- 208 W Claremore Dr
- 5835 Annapolis Dr
- 201 W Claremore Dr
- 209 Tinley Dr
- 111 W Claremore Dr
- 5829 Annapolis Dr
- 5816 Annapolis Dr
- 5831 Oak Knoll Dr
- 5920 Annapolis Dr