Estimated Value: $648,898 - $677,000
3
Beds
3
Baths
2,040
Sq Ft
$324/Sq Ft
Est. Value
About This Home
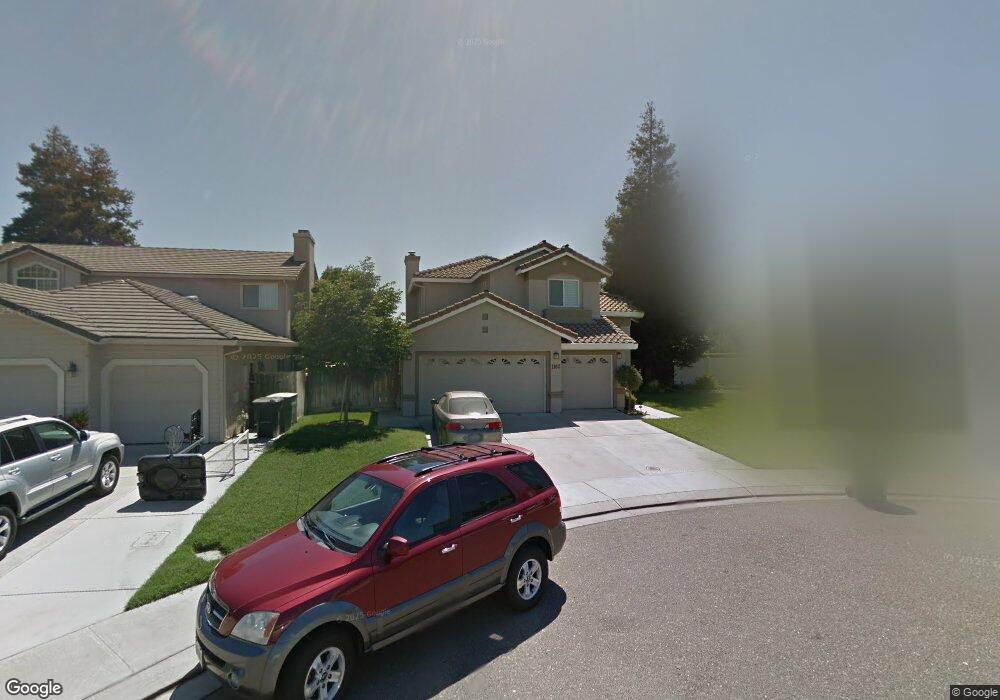
This home is located at 1180 Joseph Ct, Ripon, CA 95366 and is currently estimated at $660,975, approximately $324 per square foot. 1180 Joseph Ct is a home located in San Joaquin County with nearby schools including Weston Elementary School, Ripon Elementary School, and Ripona Elementary School.
Ownership History
Date
Name
Owned For
Owner Type
Purchase Details
Closed on
Feb 7, 2011
Sold by
Winget Cheryl C and Winget Family Trust
Bought by
Winget Cheryl C and Winget Family Trust
Current Estimated Value
Home Financials for this Owner
Home Financials are based on the most recent Mortgage that was taken out on this home.
Original Mortgage
$325,000
Interest Rate
4.74%
Mortgage Type
New Conventional
Purchase Details
Closed on
Sep 1, 2009
Sold by
Winget Cheryl
Bought by
Winget Cheryl C and Winget Family Trust
Purchase Details
Closed on
Aug 19, 2008
Sold by
Winget Cheryl
Bought by
Winget Cheryl Chris and The Winget Family Trust
Create a Home Valuation Report for This Property
The Home Valuation Report is an in-depth analysis detailing your home's value as well as a comparison with similar homes in the area
Home Values in the Area
Average Home Value in this Area
Purchase History
| Date | Buyer | Sale Price | Title Company |
|---|---|---|---|
| Winget Cheryl C | -- | Old Republic Title Company | |
| Winget Cheryl C | -- | None Available | |
| Winget Cheryl Chris | -- | None Available |
Source: Public Records
Mortgage History
| Date | Status | Borrower | Loan Amount |
|---|---|---|---|
| Closed | Winget Cheryl C | $325,000 |
Source: Public Records
Tax History
| Year | Tax Paid | Tax Assessment Tax Assessment Total Assessment is a certain percentage of the fair market value that is determined by local assessors to be the total taxable value of land and additions on the property. | Land | Improvement |
|---|---|---|---|---|
| 2025 | $4,108 | $375,262 | $95,322 | $279,940 |
| 2024 | $4,041 | $367,904 | $93,453 | $274,451 |
| 2023 | $3,959 | $360,691 | $91,621 | $269,070 |
| 2022 | $3,896 | $353,620 | $89,825 | $263,795 |
| 2021 | $3,836 | $346,687 | $88,064 | $258,623 |
| 2020 | $3,801 | $343,134 | $87,162 | $255,972 |
| 2019 | $3,736 | $336,406 | $85,453 | $250,953 |
| 2018 | $3,679 | $329,811 | $83,778 | $246,033 |
| 2017 | $3,608 | $323,345 | $82,136 | $241,209 |
| 2016 | $3,548 | $317,005 | $80,526 | $236,479 |
| 2014 | $3,413 | $306,129 | $77,763 | $228,366 |
Source: Public Records
Map
Nearby Homes
- 1122 Zumstein Ct
- 1672 Bailey Dr
- 1080 Ruess Rd
- 1434 Augusta Pointe Dr
- 924 Kingery Dr
- 1315 Augusta Pointe Dr
- 1601 Stanley Dr
- 23811 S Jack Tone Rd
- 1621 Davis St
- 1691 Davis St
- 602 S Highland Ave
- 1191 S Mohler Rd
- 916 6th St
- 336 Kristen Way
- 138 Roxie Ct
- 547 Sepp Ct
- 205 3rd St
- 150 N Acacia Ave
- 637 Rebekah Ct
- 663 Clay Way
- 1172 Joseph Ct
- 1185 Zumstein Ct
- 1179 Zumstein Ct
- 1164 Joseph Ct
- 1192 Joseph Ct
- 1169 Zumstein Ct
- 1156 Joseph Ct
- 1179 Joseph Ct
- 1192 Zumstein Ct
- 1185 Joseph Ct
- 1171 Joseph Ct
- 1157 Zumstein Ct
- 1163 Joseph Ct
- 1140 Joseph Ct
- 1149 Zumstein Ct
- 1638 Bailey Dr
- 1151 Joseph Ct
- 1180 Zumstein Ct
- 1658 Doak Blvd
- 1636 Doak Blvd
Your Personal Tour Guide
Ask me questions while you tour the home.