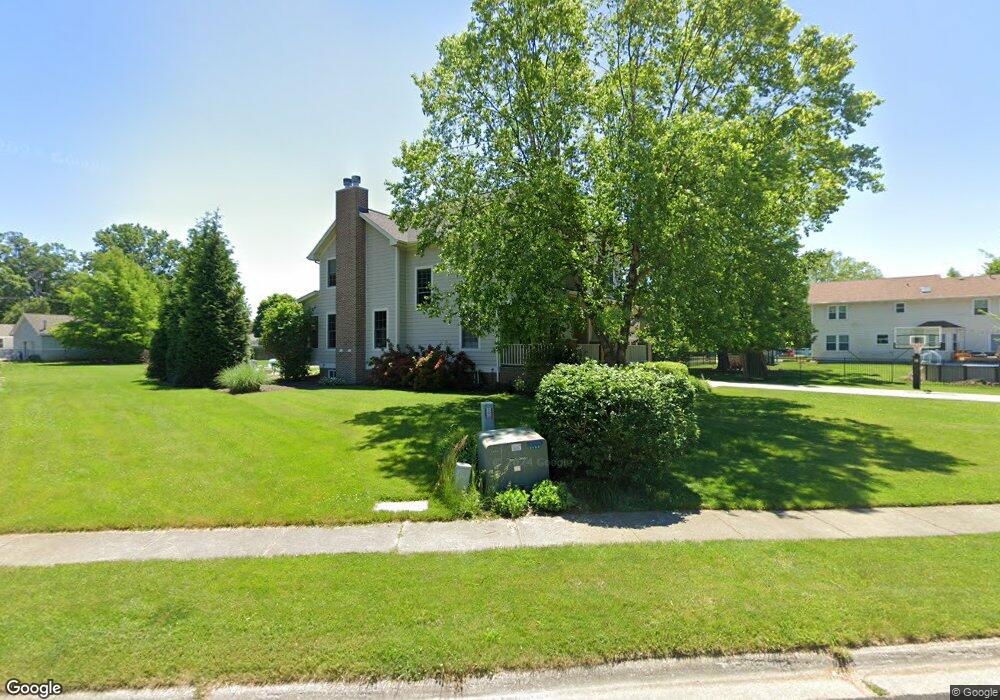
1180 Woodland Dr Chesterton, IN 46304
Estimated Value: $509,000 - $736,000
4
Beds
4
Baths
2,500
Sq Ft
$242/Sq Ft
Est. Value
About This Home
This home is located at 1180 Woodland Dr, Chesterton, IN 46304 and is currently estimated at $603,853, approximately $241 per square foot. 1180 Woodland Dr is a home located in Porter County with nearby schools including Westchester Intermediate School, Bailly Elementary School, and Chesterton Middle School.
Ownership History
Date
Name
Owned For
Owner Type
Purchase Details
Closed on
Jul 15, 2011
Sold by
Ennis Todd and Ennis Dawn
Bought by
Gotsch Thomas and Gotsch Marilyn
Current Estimated Value
Home Financials for this Owner
Home Financials are based on the most recent Mortgage that was taken out on this home.
Original Mortgage
$282,000
Outstanding Balance
$19,080
Interest Rate
4.52%
Mortgage Type
New Conventional
Estimated Equity
$584,773
Purchase Details
Closed on
Jan 20, 2009
Sold by
Ennis Todd A and Ennis Todd
Bought by
Ennis Todd and Ennis Dawn
Home Financials for this Owner
Home Financials are based on the most recent Mortgage that was taken out on this home.
Original Mortgage
$287,000
Interest Rate
4.91%
Mortgage Type
New Conventional
Purchase Details
Closed on
Apr 16, 2008
Sold by
Baciauskas Andrius and Baciauskas Danute
Bought by
Ennis Todd A
Purchase Details
Closed on
Apr 18, 2006
Sold by
Rodenas Helen R
Bought by
Baciauskas Andrius and Baciauskas Danute
Create a Home Valuation Report for This Property
The Home Valuation Report is an in-depth analysis detailing your home's value as well as a comparison with similar homes in the area
Home Values in the Area
Average Home Value in this Area
Purchase History
| Date | Buyer | Sale Price | Title Company |
|---|---|---|---|
| Gotsch Thomas | -- | Fidelity Natl Title Ins Co | |
| Ennis Todd | -- | Ticor Title Insurance Co | |
| Ennis Todd A | -- | Ticor Title Ins Co | |
| Baciauskas Andrius | -- | Ticor Title Insurance |
Source: Public Records
Mortgage History
| Date | Status | Borrower | Loan Amount |
|---|---|---|---|
| Open | Gotsch Thomas | $282,000 | |
| Previous Owner | Ennis Todd | $287,000 |
Source: Public Records
Tax History Compared to Growth
Tax History
| Year | Tax Paid | Tax Assessment Tax Assessment Total Assessment is a certain percentage of the fair market value that is determined by local assessors to be the total taxable value of land and additions on the property. | Land | Improvement |
|---|---|---|---|---|
| 2024 | $5,971 | $530,700 | $36,800 | $493,900 |
| 2023 | $6,121 | $509,000 | $34,100 | $474,900 |
| 2022 | $5,766 | $476,200 | $34,100 | $442,100 |
| 2021 | $5,606 | $448,100 | $34,100 | $414,000 |
| 2020 | $5,065 | $404,800 | $31,000 | $373,800 |
| 2019 | $5,216 | $410,800 | $31,000 | $379,800 |
| 2018 | $4,741 | $370,100 | $31,000 | $339,100 |
| 2017 | $4,782 | $377,400 | $31,000 | $346,400 |
| 2016 | $4,715 | $376,900 | $26,400 | $350,500 |
| 2014 | $4,613 | $365,400 | $25,000 | $340,400 |
| 2013 | -- | $307,800 | $25,100 | $282,700 |
Source: Public Records
Map
Nearby Homes
- 1730 S 11th St
- 2034 Texas St
- 542 Dunewood Dr
- 0 W 1050 N
- 1609 S 5th St
- 2132 Pradera Trail
- 1949 David Dr
- 2218 Pradera Trail
- 1038 N Meridian Rd
- 1978 Laura Ln
- 604 Oakwood Dr
- 2179 W 1100 N
- 1032 Preserve Ln
- 2111 Tupelo Ln
- 1108 Saratoga Ln
- 2350 Pradera Trail
- 2121 Tupelo Ln
- 1005 Preserve Ln
- 2420 Pradera Trail
- 2114 Tupelo Ln
- 1184 Woodland Dr
- 1160 W 1100 N
- 1180 W 1100 N
- 1140 W 1100 N
- 1186 Woodland Dr
- 1185 Woodland Dr
- 1181 Woodland Dr
- 1760 S 11th St
- 1120 W 1100 N
- 1193 Woodland Dr
- 1680 S 11th St
- 1190 Woodland Dr
- 1195 Woodland Dr
- 1087 Crabtree Ln
- 1660 S 11th St
- 1709 N Meridian Rd
- 1609 N Meridian Rd
- 0 W 1100 N
- 1199 Woodland Dr
- 1079 Crabtree Ln