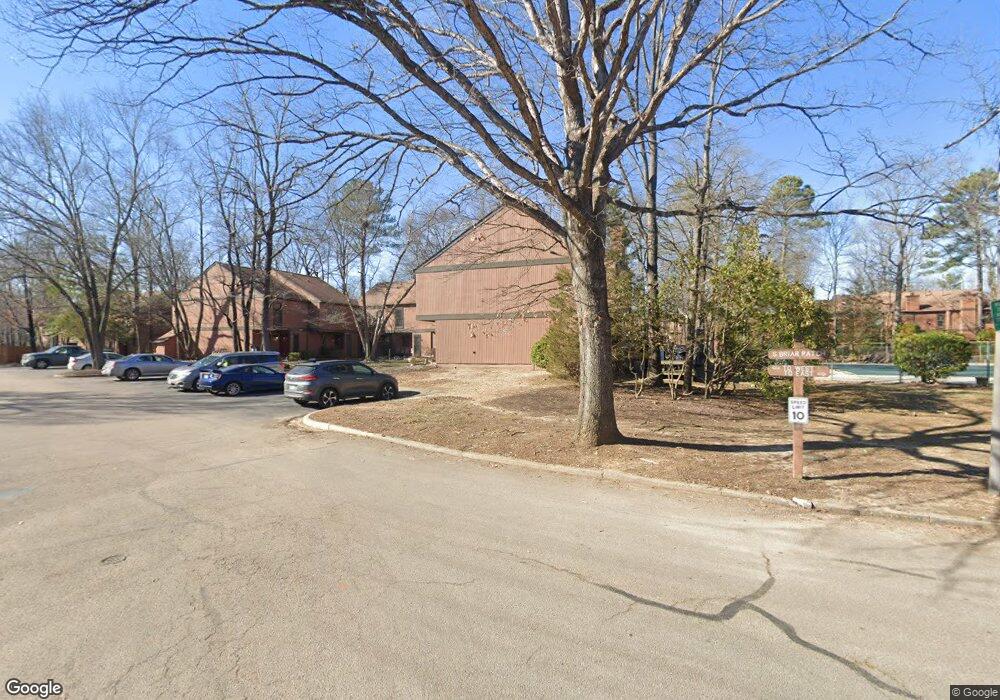
11806 S Briar Patch Dr Midlothian, VA 23113
Bon Air NeighborhoodEstimated Value: $243,000 - $254,000
3
Beds
3
Baths
1,396
Sq Ft
$177/Sq Ft
Est. Value
About This Home
This home is located at 11806 S Briar Patch Dr, Midlothian, VA 23113 and is currently estimated at $247,461, approximately $177 per square foot. 11806 S Briar Patch Dr is a home located in Chesterfield County with nearby schools including Robious Elementary School, Robious Middle School, and James River High School.
Ownership History
Date
Name
Owned For
Owner Type
Purchase Details
Closed on
Nov 18, 2015
Sold by
Roberts Michael A and Roberts Gabrielle
Bought by
Cassidy John Paul and King Ashlee Lynn
Current Estimated Value
Purchase Details
Closed on
Mar 1, 2013
Sold by
Layman Stacy Ann
Bought by
Roberts Michael A
Home Financials for this Owner
Home Financials are based on the most recent Mortgage that was taken out on this home.
Original Mortgage
$62,500
Interest Rate
3.45%
Mortgage Type
New Conventional
Purchase Details
Closed on
Oct 22, 2002
Sold by
Harris Patricia A
Bought by
Jackson Stacy A
Home Financials for this Owner
Home Financials are based on the most recent Mortgage that was taken out on this home.
Original Mortgage
$103,100
Interest Rate
6.18%
Mortgage Type
FHA
Purchase Details
Closed on
Feb 19, 1997
Sold by
Secretary Of Hud
Bought by
Cone Donald R
Home Financials for this Owner
Home Financials are based on the most recent Mortgage that was taken out on this home.
Original Mortgage
$56,000
Interest Rate
7.8%
Create a Home Valuation Report for This Property
The Home Valuation Report is an in-depth analysis detailing your home's value as well as a comparison with similar homes in the area
Home Values in the Area
Average Home Value in this Area
Purchase History
| Date | Buyer | Sale Price | Title Company |
|---|---|---|---|
| Cassidy John Paul | $129,000 | Attorney | |
| Roberts Michael A | $110,000 | -- | |
| Jackson Stacy A | $105,500 | -- | |
| Cone Donald R | -- | -- |
Source: Public Records
Mortgage History
| Date | Status | Borrower | Loan Amount |
|---|---|---|---|
| Previous Owner | Roberts Michael A | $62,500 | |
| Previous Owner | Cone Donald R | $103,100 | |
| Previous Owner | Cone Donald R | $56,000 |
Source: Public Records
Tax History
| Year | Tax Paid | Tax Assessment Tax Assessment Total Assessment is a certain percentage of the fair market value that is determined by local assessors to be the total taxable value of land and additions on the property. | Land | Improvement |
|---|---|---|---|---|
| 2025 | $2,155 | $241,300 | $52,000 | $189,300 |
| 2024 | $2,155 | $224,400 | $39,000 | $185,400 |
| 2023 | $1,718 | $188,800 | $34,000 | $154,800 |
| 2022 | $1,634 | $177,600 | $32,000 | $145,600 |
| 2021 | $1,550 | $162,400 | $30,000 | $132,400 |
| 2020 | $1,487 | $156,500 | $30,000 | $126,500 |
| 2019 | $1,434 | $150,900 | $29,000 | $121,900 |
| 2018 | $1,382 | $145,500 | $28,000 | $117,500 |
| 2017 | $1,271 | $132,400 | $26,000 | $106,400 |
| 2016 | $1,213 | $126,400 | $25,000 | $101,400 |
| 2015 | $1,148 | $119,600 | $25,000 | $94,600 |
| 2014 | $1,031 | $107,400 | $23,000 | $84,400 |
Source: Public Records
Map
Nearby Homes
- 11823 N Briar Patch Dr
- 11803 N Briar Patch Dr
- 11611 E Briar Patch Dr
- 11911 Kilrenny Rd
- 12111 Framar Dr
- 1516 Sandgate Rd
- 1336 Tannery Cir
- 12300 Little Pond Ln
- 12212 Deerhurst Dr
- 2101 Normandstone Dr
- 1407 Unison Dr
- 1303 Staffordshire Ct
- 11013 Rockledge Rd
- 2813 Live Oak Ln
- 12606 Mill Lock Terrace
- 1860 Glamorgan Ln
- 627 Hazeltine Ct
- 12406 Carnoustie Ln Unit B
- 2711 Salisbury Rd
- 12213 Capwell Dr
- 11806 S Briar Patch Dr Unit Corner
- 11806 S Briar Patch Dr Unit 11806
- 11808 S Briar Patch Dr
- 11804 S Briar Patch Dr
- 11810 S Briar Patch Dr
- 11802 S Briar Patch Dr
- 11812 S Briar Patch Dr
- 11812 S Briar Patch Dr Unit 11812
- 11800 S Briar Patch Dr
- 11800 S Briar Patch Dr Unit 11800
- 11800 S Briar Patch Dr
- 11813 N Briar Patch Dr
- 11817 N Briar Patch Dr
- 11819 N Briar Patch Dr
- 11819 N Briar Patch Dr Unit 11819
- 11816 S Briar Patch Dr
- 11816 S Briar Patch Dr
- 11811 N Briar Patch Dr
- 11811 N Briar Patch Dr Unit 11811
- 11818 S Briar Patch Dr
Your Personal Tour Guide
Ask me questions while you tour the home.