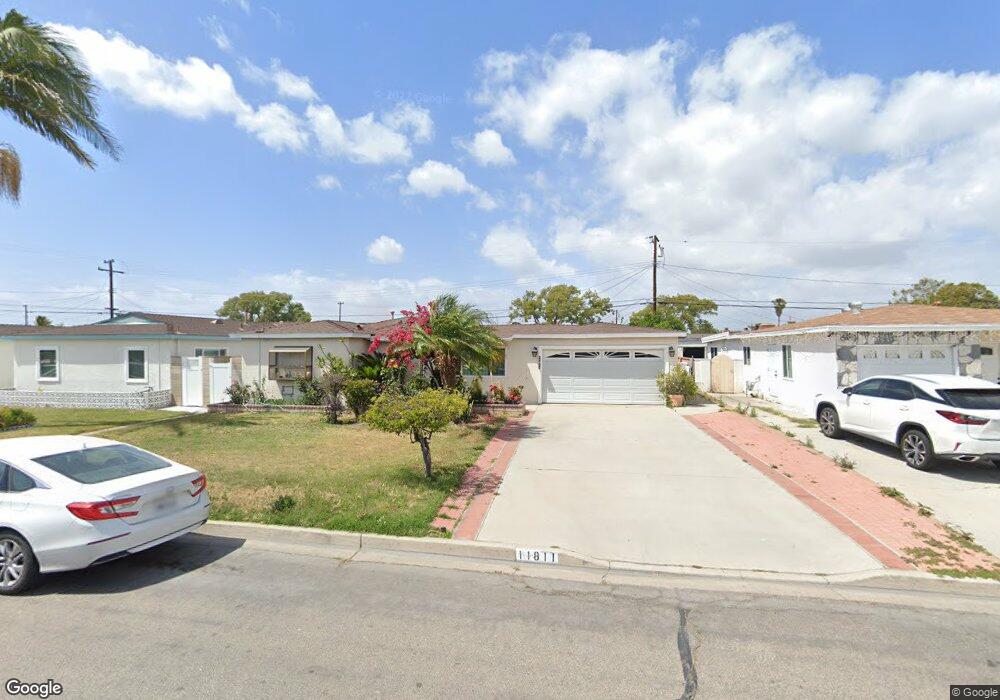
11811 Rexford Rd Garden Grove, CA 92840
Estimated Value: $875,709 - $1,102,000
4
Beds
2
Baths
1,158
Sq Ft
$834/Sq Ft
Est. Value
About This Home
This home is located at 11811 Rexford Rd, Garden Grove, CA 92840 and is currently estimated at $966,177, approximately $834 per square foot. 11811 Rexford Rd is a home located in Orange County with nearby schools including Crosby Elementary School, Izaak Walton Intermediate School, and Garden Grove High School.
Ownership History
Date
Name
Owned For
Owner Type
Purchase Details
Closed on
Jul 9, 2024
Sold by
Do Loi Khac and Nguyen Nga Kim
Bought by
2024 Loi Do & Nga Nguyen Revocable Living Tru and Do
Current Estimated Value
Purchase Details
Closed on
Jan 9, 1998
Sold by
Washington Mutual Bank Fa
Bought by
Do Loi Khac and Nguyen Nga Kim Thi
Home Financials for this Owner
Home Financials are based on the most recent Mortgage that was taken out on this home.
Original Mortgage
$118,000
Interest Rate
7.05%
Purchase Details
Closed on
Nov 10, 1997
Sold by
Rosalia Unzueta and Rosalia Enrique
Bought by
Washington Mutual Fa
Home Financials for this Owner
Home Financials are based on the most recent Mortgage that was taken out on this home.
Original Mortgage
$118,000
Interest Rate
7.05%
Create a Home Valuation Report for This Property
The Home Valuation Report is an in-depth analysis detailing your home's value as well as a comparison with similar homes in the area
Home Values in the Area
Average Home Value in this Area
Purchase History
| Date | Buyer | Sale Price | Title Company |
|---|---|---|---|
| 2024 Loi Do & Nga Nguyen Revocable Living Tru | -- | None Listed On Document | |
| Do Loi Khac | $157,500 | Chicago Title Co | |
| Washington Mutual Fa | $101,500 | Chicago Title Co |
Source: Public Records
Mortgage History
| Date | Status | Borrower | Loan Amount |
|---|---|---|---|
| Previous Owner | Do Loi Khac | $118,000 |
Source: Public Records
Tax History Compared to Growth
Tax History
| Year | Tax Paid | Tax Assessment Tax Assessment Total Assessment is a certain percentage of the fair market value that is determined by local assessors to be the total taxable value of land and additions on the property. | Land | Improvement |
|---|---|---|---|---|
| 2025 | $3,293 | $251,475 | $175,811 | $75,664 |
| 2024 | $3,293 | $246,545 | $172,364 | $74,181 |
| 2023 | $3,229 | $241,711 | $168,984 | $72,727 |
| 2022 | $3,155 | $236,972 | $165,671 | $71,301 |
| 2021 | $3,110 | $232,326 | $162,423 | $69,903 |
| 2020 | $3,073 | $229,944 | $160,757 | $69,187 |
| 2019 | $3,032 | $225,436 | $157,605 | $67,831 |
| 2018 | $2,959 | $221,016 | $154,515 | $66,501 |
| 2017 | $2,927 | $216,683 | $151,485 | $65,198 |
| 2016 | $2,787 | $212,435 | $148,515 | $63,920 |
| 2015 | $2,750 | $209,245 | $146,285 | $62,960 |
| 2014 | $2,685 | $205,147 | $143,420 | $61,727 |
Source: Public Records
Map
Nearby Homes
- 11841 Shetland Rd
- 12662 Woodland Ln
- 12727 West St
- 12246 Nadine Cir
- 405 13181 Lampson
- 11731 Rose Dr
- 12501 Dessa Dr
- 12851 Newhope St
- 12861 West St Unit 157
- 12861 West St Unit 100
- 12222 Emrys Ave
- 11841 Debbie Ln
- 13052 Rockinghorse Rd
- 11252 Chapman Ave
- 11081 Iris Dr
- 11102 Avolencia Place
- 12332 Euclid St
- 11052 Peppertree Ln
- 12600 Euclid St Unit 19
- 11662 Puryear Ln
- 11821 Rexford Rd
- 11801 Rexford Rd
- 11812 Comstock Rd
- 11831 Rexford Rd
- 11791 Rexford Rd
- 11802 Comstock Rd
- 11822 Comstock Rd
- 11812 Rexford Rd
- 11832 Comstock Rd
- 11792 Comstock Rd
- 11822 Rexford Rd
- 11802 Rexford Rd
- 11841 Rexford Rd
- 11771 Rexford Rd
- 11832 Rexford Rd
- 11792 Rexford Rd
- 11842 Comstock Rd
- 11772 Comstock Rd
- 11851 Rexford Rd
- 11842 Rexford Rd