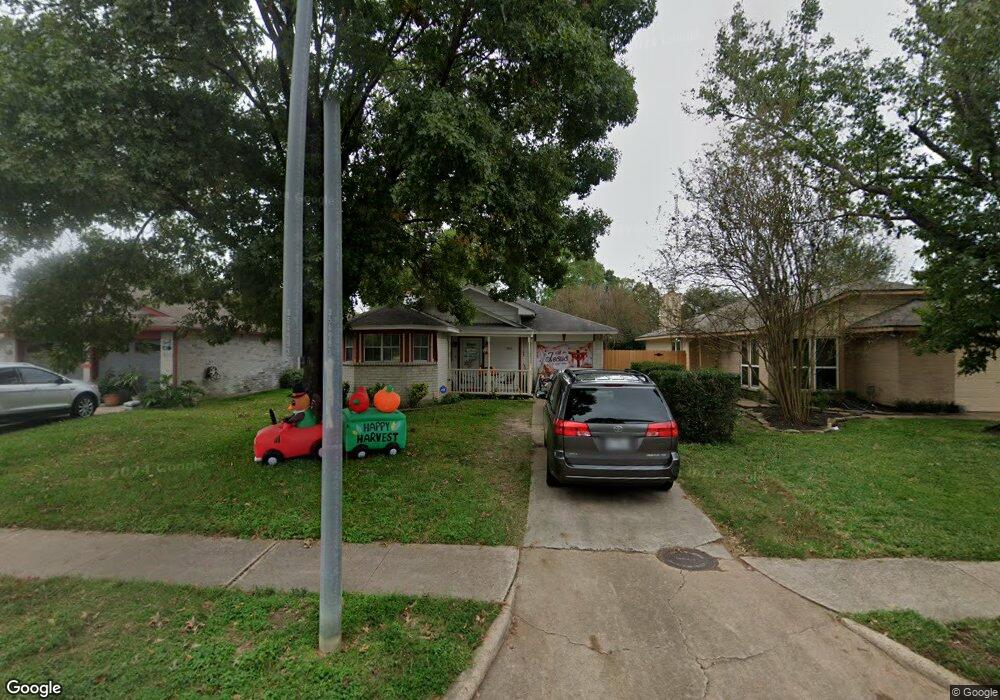
11815 Westlock Dr Tomball, TX 77377
Northpointe NeighborhoodEstimated Value: $171,000 - $208,000
3
Beds
2
Baths
1,138
Sq Ft
$167/Sq Ft
Est. Value
About This Home
This home is located at 11815 Westlock Dr, Tomball, TX 77377 and is currently estimated at $190,241, approximately $167 per square foot. 11815 Westlock Dr is a home located in Harris County with nearby schools including Willow Creek Elementary School, Willow Wood Junior High School, and Northpointe Intermediate School.
Ownership History
Date
Name
Owned For
Owner Type
Purchase Details
Closed on
May 7, 2015
Sold by
Mccabe Andrew M and Schembre Mccabe Josephine
Bought by
Doerr Alan
Current Estimated Value
Home Financials for this Owner
Home Financials are based on the most recent Mortgage that was taken out on this home.
Original Mortgage
$85,200
Outstanding Balance
$31,771
Interest Rate
3.74%
Mortgage Type
New Conventional
Estimated Equity
$158,470
Purchase Details
Closed on
Oct 24, 2011
Sold by
Deutsche Bank National Trust Company
Bought by
Mccabe Andrew M and Schembre Mccabe Josephina
Purchase Details
Closed on
Jun 20, 2011
Sold by
Campos Araceli and Ordonez Jose
Bought by
Deutsche Bank National Trust Company
Purchase Details
Closed on
Sep 20, 2005
Sold by
Wiley Shirley A
Bought by
Campos Araceli
Home Financials for this Owner
Home Financials are based on the most recent Mortgage that was taken out on this home.
Original Mortgage
$79,900
Interest Rate
7.5%
Mortgage Type
Stand Alone First
Create a Home Valuation Report for This Property
The Home Valuation Report is an in-depth analysis detailing your home's value as well as a comparison with similar homes in the area
Home Values in the Area
Average Home Value in this Area
Purchase History
| Date | Buyer | Sale Price | Title Company |
|---|---|---|---|
| Doerr Alan | -- | None Available | |
| Mccabe Andrew M | -- | Lsi Title Agency Inc | |
| Deutsche Bank National Trust Company | $62,550 | None Available | |
| Campos Araceli | -- | Startex Title Company |
Source: Public Records
Mortgage History
| Date | Status | Borrower | Loan Amount |
|---|---|---|---|
| Open | Doerr Alan | $85,200 | |
| Previous Owner | Campos Araceli | $79,900 |
Source: Public Records
Tax History Compared to Growth
Tax History
| Year | Tax Paid | Tax Assessment Tax Assessment Total Assessment is a certain percentage of the fair market value that is determined by local assessors to be the total taxable value of land and additions on the property. | Land | Improvement |
|---|---|---|---|---|
| 2025 | $3,778 | $164,094 | $40,140 | $123,954 |
| 2024 | $3,778 | $161,972 | $40,140 | $121,832 |
| 2023 | $3,778 | $173,000 | $40,140 | $132,860 |
| 2022 | $3,702 | $147,500 | $33,744 | $113,756 |
| 2021 | $2,802 | $108,772 | $30,877 | $77,895 |
| 2020 | $2,984 | $110,793 | $24,261 | $86,532 |
| 2019 | $3,100 | $113,475 | $20,952 | $92,523 |
| 2018 | $2,870 | $103,541 | $15,880 | $87,661 |
| 2017 | $2,635 | $94,000 | $15,880 | $78,120 |
| 2016 | $2,635 | $94,000 | $15,880 | $78,120 |
| 2015 | $1,630 | $85,566 | $15,880 | $69,686 |
| 2014 | $1,630 | $77,240 | $15,880 | $61,360 |
Source: Public Records
Map
Nearby Homes
- 11831 Westlock Dr
- 11922 Westwold Dr
- 11934 Westwold Dr
- 11902 Oakner Dr
- 12007 Northpointe Meadows Dr
- 12046 Westlock Dr
- 18314 Westlock St
- 12107 Westwold Dr
- 12226 Westwold Dr
- 12242 Westlock Dr
- 12022 Canyon Star Ln
- 12222 Brighton Brook Ln
- 12006 Canyon Star Ln
- 12331 Westwold Dr
- 17826 Island Spring Ln
- 17814 Winkler Willow Ct
- 18135 Gravenhurst Ln
- 19010 Canyon Star Ct
- 17914 Logans Pine Dr
- 17902 Logans Pine Dr
- 11819 Westlock Dr
- 11811 Westlock Dr
- 11823 Westlock Dr
- 11807 Westlock Dr
- 11814 Westwold Dr
- 11818 Westwold Dr
- 11812 Westwold Dr
- 11827 Westlock Dr
- 11803 Westlock Dr
- 11822 Westwold Dr
- 11810 Westwold Dr
- 11826 Westwold Dr
- 11806 Westwold Dr
- 11818 Westlock Dr
- 11814 Westlock Dr
- 11822 Westlock Dr
- 11810 Westlock Dr
- 11830 Westwold Dr
- 11826 Westlock Dr
- 11806 Westlock Dr