
Seller's Agent in 2026
Andrea Pazmino-Pace
HomeSmart Realty Group
(626) 590-1289
18 Total Sales
Estimated Value: $734,436 - $922,000
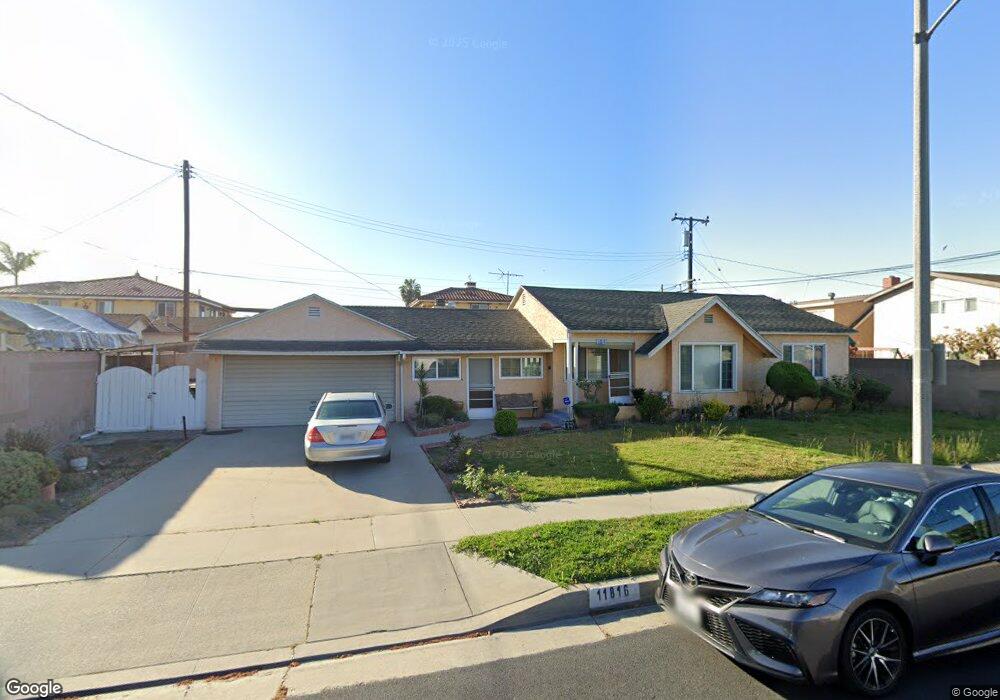
First time for sale in 49 years, this home is full of potential, with 3 Beds, 2 Baths, and a large den that can be converted in an ADU, storage, or a family room. With a 2-car garage. Laundry area. It is conveniently located in a residential area close to the 105 and 710 freeways, with easy access to all the restaurants and services that the city of Downey provides. Ideal for a family that wants to make it their own style .
We collect this data history from publicly available records. To have your information removed, we recommend requesting removal directly through your county’s website.
We collect this data history from publicly available records. To have your information removed, we recommend requesting removal directly through your county’s website.
| Date | Buyer | Sale Price | Title Company |
|---|---|---|---|
| -- | None Listed On Document |
We collect this data history from publicly available records. To have your information removed, we recommend requesting removal directly through your county’s website.
| Date | Event | Price | List to Sale | Price per Sq Ft |
|---|---|---|---|---|
| 06/03/2026 06/03/26 | For Sale | $764,000 | 0.0% | $485 / Sq Ft |
| 06/02/2026 06/02/26 | Off Market | $764,000 | -- | -- |
| 05/17/2026 05/17/26 | For Sale | $764,000 | -- | $485 / Sq Ft |
We collect this data history from publicly available records. To have your information removed, we recommend requesting removal directly through your county’s website.
| Year | Tax Paid | Tax Assessment Tax Assessment Total Assessment is a certain percentage of the fair market value that is determined by local assessors to be the total taxable value of land and additions on the property. | Land | Improvement |
|---|---|---|---|---|
| 2025 | $4,006 | $299,296 | $147,146 | $152,150 |
| 2024 | $3,930 | $293,428 | $144,261 | $149,167 |
| 2023 | $3,802 | $287,676 | $141,433 | $146,243 |
| 2022 | $3,617 | $282,036 | $138,660 | $143,376 |
| 2021 | $3,524 | $276,507 | $135,942 | $140,565 |
| 2020 | $3,472 | $273,673 | $134,549 | $139,124 |
| 2019 | $3,434 | $268,308 | $131,911 | $136,397 |
| 2018 | $3,295 | $263,048 | $129,325 | $133,723 |
| 2016 | $3,182 | $252,835 | $124,304 | $128,531 |
| 2015 | $3,136 | $249,038 | $122,437 | $126,601 |
| 2014 | $2,967 | $244,161 | $120,039 | $124,122 |
Seller's Agent in 2026
Andrea Pazmino-Pace
HomeSmart Realty Group
(626) 590-1289
18 Total Sales
Ask me questions while you tour the home.