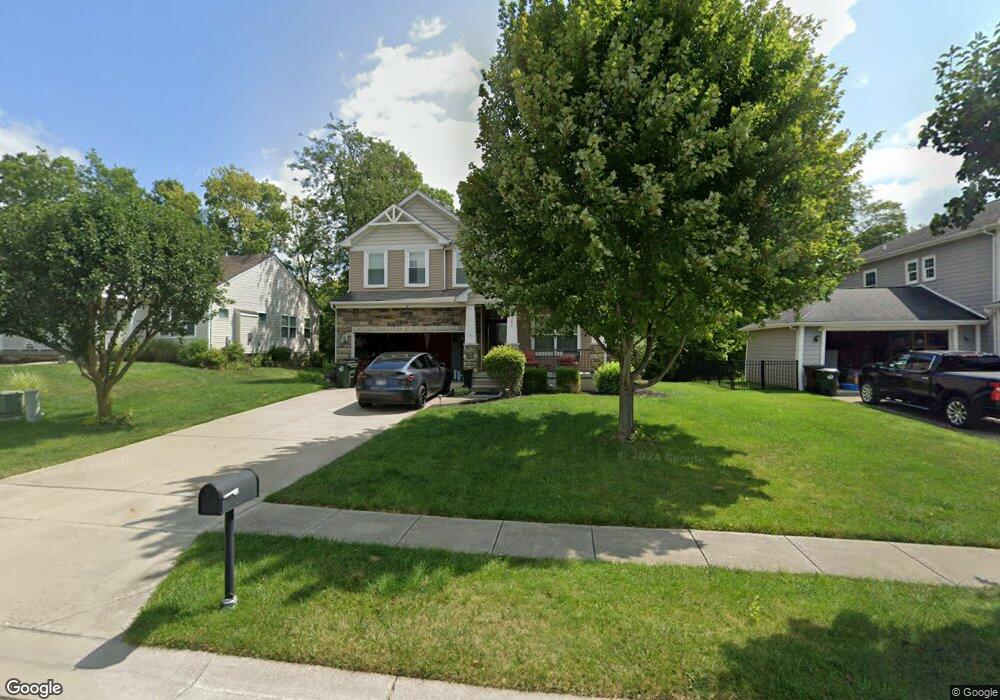
1182 Walnut Creek Unit TRACE Lebanon, OH 45036
Estimated Value: $415,000 - $441,000
5
Beds
4
Baths
2,250
Sq Ft
$189/Sq Ft
Est. Value
About This Home
This home is located at 1182 Walnut Creek Unit TRACE, Lebanon, OH 45036 and is currently estimated at $424,669, approximately $188 per square foot. 1182 Walnut Creek Unit TRACE is a home located in Warren County with nearby schools including Bowman Primary School, Berry Intermediate School, and Donovan Elementary School.
Ownership History
Date
Name
Owned For
Owner Type
Purchase Details
Closed on
May 31, 2016
Sold by
Schorr Elizabeth A and Seacrest Elizabeth A
Bought by
Gillespie Erika J and Gillespie Charles
Current Estimated Value
Home Financials for this Owner
Home Financials are based on the most recent Mortgage that was taken out on this home.
Original Mortgage
$176,000
Outstanding Balance
$140,259
Interest Rate
3.61%
Mortgage Type
New Conventional
Estimated Equity
$284,410
Purchase Details
Closed on
Mar 31, 2010
Sold by
Potterhill Homes Llc
Bought by
Schorr Elizabeth A and Schorr Rolf
Home Financials for this Owner
Home Financials are based on the most recent Mortgage that was taken out on this home.
Original Mortgage
$168,411
Interest Rate
4.96%
Mortgage Type
New Conventional
Purchase Details
Closed on
Dec 26, 2007
Sold by
Potter Hill Homes Llc
Bought by
Rolfes Carolyn
Purchase Details
Closed on
Aug 17, 2004
Sold by
Liberty Crossing Llc
Bought by
Potter Hill Llc
Create a Home Valuation Report for This Property
The Home Valuation Report is an in-depth analysis detailing your home's value as well as a comparison with similar homes in the area
Home Values in the Area
Average Home Value in this Area
Purchase History
| Date | Buyer | Sale Price | Title Company |
|---|---|---|---|
| Gillespie Erika J | -- | Attorney | |
| Schorr Elizabeth A | $210,533 | Springdale Title | |
| Rolfes Carolyn | -- | Springdale Title Agency Llc | |
| Potter Hill Llc | -- | -- |
Source: Public Records
Mortgage History
| Date | Status | Borrower | Loan Amount |
|---|---|---|---|
| Open | Gillespie Erika J | $176,000 | |
| Previous Owner | Schorr Elizabeth A | $168,411 |
Source: Public Records
Tax History Compared to Growth
Tax History
| Year | Tax Paid | Tax Assessment Tax Assessment Total Assessment is a certain percentage of the fair market value that is determined by local assessors to be the total taxable value of land and additions on the property. | Land | Improvement |
|---|---|---|---|---|
| 2024 | $5,070 | $122,100 | $28,000 | $94,100 |
| 2023 | $4,457 | $96,453 | $16,520 | $79,933 |
| 2022 | $4,646 | $96,453 | $16,520 | $79,933 |
| 2021 | $4,391 | $96,453 | $16,520 | $79,933 |
| 2020 | $4,406 | $81,739 | $14,000 | $67,739 |
| 2019 | $4,013 | $74,095 | $14,000 | $60,095 |
| 2018 | $3,439 | $74,095 | $14,000 | $60,095 |
| 2017 | $3,210 | $62,055 | $11,918 | $50,138 |
| 2016 | $3,312 | $62,055 | $11,918 | $50,138 |
| 2015 | $3,336 | $62,055 | $11,918 | $50,138 |
| 2014 | $3,373 | $60,250 | $11,570 | $48,680 |
| 2013 | $3,245 | $72,900 | $14,000 | $58,900 |
Source: Public Records
Map
Nearby Homes
- 1112 Hubbell Ct
- 917 Kerns Dr
- 1033 Country Creek Dr
- 465 Creekside Dr
- 531 Quail Ct
- 911 Birchwood Dr
- 532 French Run Ct
- 1 Dryhill Ct
- 19 Hathaway Commons
- 1443 N Broadway St
- 11 Roxie Ct
- 781 Oleander Ct
- 908 Hartz Dr
- 954 Southline Dr
- 409 Bethpage Way Unit 7-301
- 5 Acres Ave
- 409 Bethpage Way
- 5 Acres Lot D Phillips Rd
- 702 Southline Dr
- 1182 Walnut Creek
- 1182 Walnut Creek Unit TRAIL
- 1200 Walnut Creek Trail
- 1200 Walnut Creek Trail
- 1176 Walnut Creek
- 1176 Walnut Creek Trail
- 1176 Walnut Creek Unit TRL
- 1206 Walnut Creek
- 1170 Walnut Creek Trail
- 1181 Walnut Creek
- 1181 Walnut Creek Unit TRL
- 1164 Walnut Creek
- 1164 Walnut Creek Unit TRL
- 1212 Walnut Creek Trail
- 1175 Walnut Creek
- 1175 Walnut Creek Trail
- 402 Raintree Trail
- 1169 Walnut Creek
- 1218 Walnut Creek
- 1158 Walnut Creek Trail