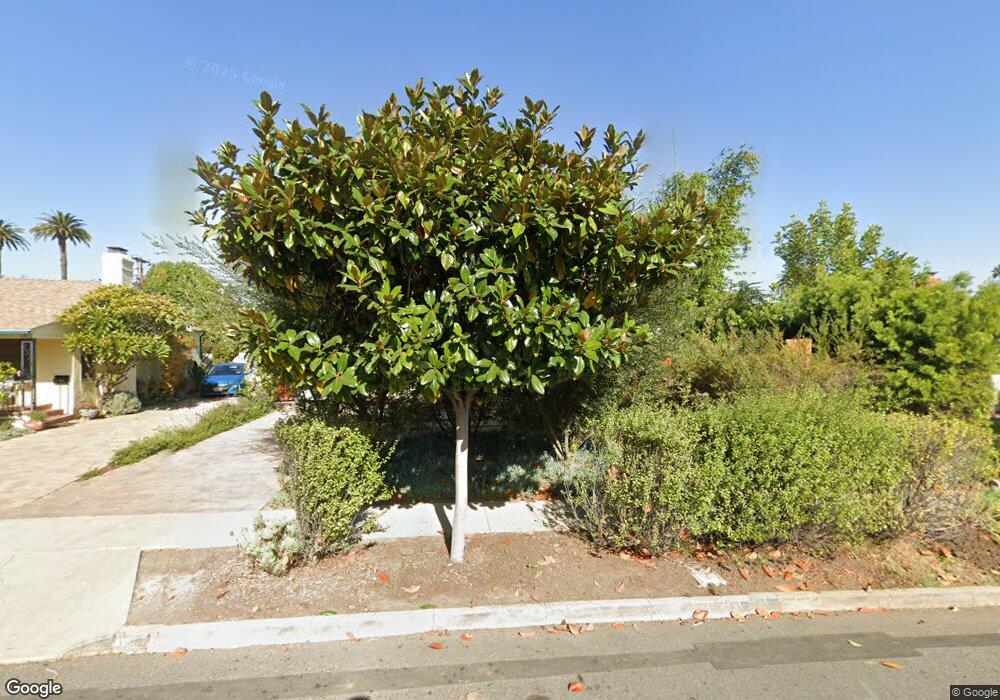
11825 Atlantic Ave Los Angeles, CA 90066
Del Rey NeighborhoodEstimated Value: $1,349,537 - $2,213,000
3
Beds
2
Baths
1,843
Sq Ft
$1,012/Sq Ft
Est. Value
About This Home
This home is located at 11825 Atlantic Ave, Los Angeles, CA 90066 and is currently estimated at $1,865,134, approximately $1,012 per square foot. 11825 Atlantic Ave is a home located in Los Angeles County with nearby schools including La Ballona Elementary School, Culver City Middle School, and Culver City High School.
Ownership History
Date
Name
Owned For
Owner Type
Purchase Details
Closed on
Feb 3, 2017
Sold by
Gilgar Stephanie
Bought by
Gilgar Stephanie and The Stephanie Gilgar Trust
Current Estimated Value
Purchase Details
Closed on
Mar 3, 2015
Sold by
Eckhous Nancy
Bought by
Corlin Alan
Home Financials for this Owner
Home Financials are based on the most recent Mortgage that was taken out on this home.
Original Mortgage
$588,000
Interest Rate
3.54%
Mortgage Type
New Conventional
Purchase Details
Closed on
Jan 21, 2015
Sold by
Corlin Alan and Corlin Alan Burt
Bought by
Gilgar Stephanie
Home Financials for this Owner
Home Financials are based on the most recent Mortgage that was taken out on this home.
Original Mortgage
$588,000
Interest Rate
3.54%
Mortgage Type
New Conventional
Purchase Details
Closed on
Jun 6, 2002
Sold by
Corlin Alan and Corlin Lisa
Bought by
Corlin Alan
Home Financials for this Owner
Home Financials are based on the most recent Mortgage that was taken out on this home.
Original Mortgage
$180,000
Interest Rate
5.97%
Create a Home Valuation Report for This Property
The Home Valuation Report is an in-depth analysis detailing your home's value as well as a comparison with similar homes in the area
Home Values in the Area
Average Home Value in this Area
Purchase History
| Date | Buyer | Sale Price | Title Company |
|---|---|---|---|
| Gilgar Stephanie | -- | None Available | |
| Corlin Alan | -- | First American Title Company | |
| Gilgar Stephanie | $735,000 | Fatcola | |
| Corlin Alan | -- | Act |
Source: Public Records
Mortgage History
| Date | Status | Borrower | Loan Amount |
|---|---|---|---|
| Previous Owner | Gilgar Stephanie | $588,000 | |
| Previous Owner | Corlin Alan | $180,000 |
Source: Public Records
Tax History Compared to Growth
Tax History
| Year | Tax Paid | Tax Assessment Tax Assessment Total Assessment is a certain percentage of the fair market value that is determined by local assessors to be the total taxable value of land and additions on the property. | Land | Improvement |
|---|---|---|---|---|
| 2025 | $12,205 | $978,213 | $600,920 | $377,293 |
| 2024 | $12,205 | $959,034 | $589,138 | $369,896 |
| 2023 | $11,477 | $940,231 | $577,587 | $362,644 |
| 2022 | $10,954 | $921,796 | $566,262 | $355,534 |
| 2021 | $10,889 | $903,722 | $555,159 | $348,563 |
| 2020 | $10,792 | $894,456 | $549,467 | $344,989 |
| 2019 | $10,497 | $876,919 | $538,694 | $338,225 |
| 2018 | $9,296 | $776,353 | $528,132 | $248,221 |
| 2016 | $8,724 | $746,208 | $507,625 | $238,583 |
| 2015 | $4,968 | $411,048 | $405,652 | $5,396 |
| 2014 | $5,000 | $402,997 | $397,706 | $5,291 |
Source: Public Records
Map
Nearby Homes
- 4232 East Blvd
- 11831 Courtleigh Dr Unit 203
- 4232 Mclaughlin Ave
- 4130 Mclaughlin Ave
- 11905 Avon Way
- 11722 Avon Way Unit 103
- 11722 Avon Way Unit 204
- 11938 Courtleigh Dr Unit 3
- 4365 Mclaughlin Ave Unit 25
- 4365 Mclaughlin Ave Unit 13
- 4430 Inglewood Blvd
- 4125 Inglewood Blvd Unit 10
- 12044 Washington Blvd
- 12030 Sylvester St
- 4430 Lindblade Dr
- 11852 Washington Place Unit 7
- 11852 Washington Place Unit 6
- 11852 Washington Place Unit 5
- 11852 Washington Place Unit 1
- 11852 Washington Place Unit 8
- 11831 Atlantic Ave
- 11835 Atlantic Ave
- 11815 Atlantic Ave
- 11800 S Park Ave
- 4221 East Blvd
- 11832 Atlantic Ave
- 11812 S Park Ave
- 4227 East Blvd
- 11839 Atlantic Ave
- 11818 S Park Ave
- 11836 Atlantic Ave
- 11741 W Washington Blvd
- 11741 W Washington Blvd
- 11824 S Park Ave
- 11737 W Washington Blvd
- 11840 Atlantic Ave
- 4249 East Blvd Unit 2
- 4249 East Blvd
- 4249 East Blvd Unit 6
- 4249 East Blvd Unit 5