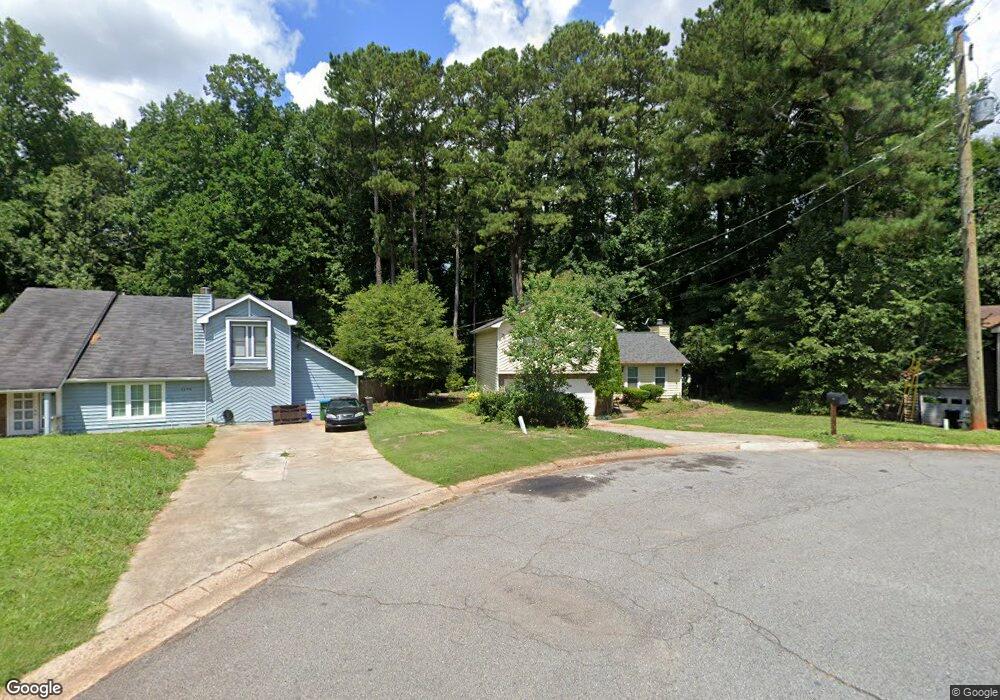
1183 Garden Place Norcross, GA 30093
Estimated Value: $315,523 - $364,000
4
Beds
3
Baths
1,200
Sq Ft
$283/Sq Ft
Est. Value
About This Home
This home is located at 1183 Garden Place, Norcross, GA 30093 and is currently estimated at $339,131, approximately $282 per square foot. 1183 Garden Place is a home located in Gwinnett County with nearby schools including Lilburn Elementary School, Lilburn Middle School, and Meadowcreek High School.
Ownership History
Date
Name
Owned For
Owner Type
Purchase Details
Closed on
Aug 27, 2025
Sold by
Chen Wei
Bought by
1183 Garden Pl Llc
Current Estimated Value
Purchase Details
Closed on
Jun 7, 2010
Sold by
Amtrust Bk
Bought by
Chen Wei and Chen Hongtao
Purchase Details
Closed on
Jul 7, 2009
Sold by
Canales Rafael T
Bought by
Amtrust Bk
Purchase Details
Closed on
Nov 5, 2004
Sold by
Dixon Duane and Dixon Elizabeth
Bought by
Canales Rafael T
Home Financials for this Owner
Home Financials are based on the most recent Mortgage that was taken out on this home.
Original Mortgage
$132,000
Interest Rate
5.67%
Mortgage Type
New Conventional
Purchase Details
Closed on
Feb 4, 1999
Sold by
Dixon Eliaabeth D
Bought by
Dixon Elizabeth D and Dixon Duane
Home Financials for this Owner
Home Financials are based on the most recent Mortgage that was taken out on this home.
Original Mortgage
$89,600
Interest Rate
6.79%
Mortgage Type
New Conventional
Purchase Details
Closed on
Dec 28, 1995
Sold by
Carlton Robert Laurie
Bought by
Mulkey Elizabeth
Create a Home Valuation Report for This Property
The Home Valuation Report is an in-depth analysis detailing your home's value as well as a comparison with similar homes in the area
Home Values in the Area
Average Home Value in this Area
Purchase History
| Date | Buyer | Sale Price | Title Company |
|---|---|---|---|
| 1183 Garden Pl Llc | -- | -- | |
| Chen Wei | $48,800 | -- | |
| Amtrust Bk | $105,564 | -- | |
| Canales Rafael T | $132,000 | -- | |
| Dixon Elizabeth D | -- | -- | |
| Mulkey Elizabeth | $91,000 | -- |
Source: Public Records
Mortgage History
| Date | Status | Borrower | Loan Amount |
|---|---|---|---|
| Previous Owner | Canales Rafael T | $132,000 | |
| Previous Owner | Dixon Elizabeth D | $89,600 | |
| Closed | Mulkey Elizabeth | $0 |
Source: Public Records
Tax History Compared to Growth
Tax History
| Year | Tax Paid | Tax Assessment Tax Assessment Total Assessment is a certain percentage of the fair market value that is determined by local assessors to be the total taxable value of land and additions on the property. | Land | Improvement |
|---|---|---|---|---|
| 2025 | $4,508 | $118,920 | $21,120 | $97,800 |
| 2024 | $4,332 | $112,640 | $21,120 | $91,520 |
| 2023 | $4,332 | $107,720 | $24,800 | $82,920 |
| 2022 | $0 | $91,200 | $22,400 | $68,800 |
| 2021 | $2,775 | $68,880 | $16,000 | $52,880 |
| 2020 | $2,790 | $68,880 | $16,000 | $52,880 |
| 2019 | $2,249 | $56,240 | $13,600 | $42,640 |
| 2018 | $2,246 | $56,240 | $13,600 | $42,640 |
| 2016 | $1,720 | $40,720 | $10,400 | $30,320 |
| 2015 | $1,531 | $34,880 | $8,000 | $26,880 |
| 2014 | $1,538 | $34,880 | $8,000 | $26,880 |
Source: Public Records
Map
Nearby Homes
- 5554 Clover Rise Ln Unit 2
- 1013 Sandune Dr
- 5605 Rock Place Ct
- 936 Six Oaks Cir Unit B
- 5425 Village Green Square Unit 3
- 897 Six Oaks Cir Unit B
- 1133 Sandune Dr
- 5622 Williamsburg Dr
- 5775 Dekalb Ln
- 1258 Roman Point Dr
- 1353 Harbins Ridge Dr Unit 36
- 5719 Singlebriar Ct
- 1437 Roman Point Dr
- 5331 Sherwin Dr
- 5333 Bishops Cir
- 5323 Sherwin Dr
- 5271 Williams Rd Unit A-1
- 5681 Williams Rd
- 5738 Brooklyn Ln
- 0 Harbins Rd NW Unit 7598091
- 1173 Garden Place
- 1192 Garden Place
- 1214 Willow Brook Ct
- 1204 Willow Brook Ct Unit I
- 5548 Willow Brook Dr
- 1163 Garden Place
- 1186 Longview Ct
- 1182 Garden Place Unit 8
- 1182 Garden Place
- 1224 Willow Brook Ct
- 1205 Willow Brook Ct
- 1172 Garden Place
- 5558 Willow Brook Dr Unit 1
- 1176 Longview Ct
- 5543 Garden Place
- 1215 Willow Brook Ct
- 1196 Longview Ct
- 1166 Longview Ct
- 5559 Willow Brook Dr Unit 9
- 5559 Willow Brook Dr