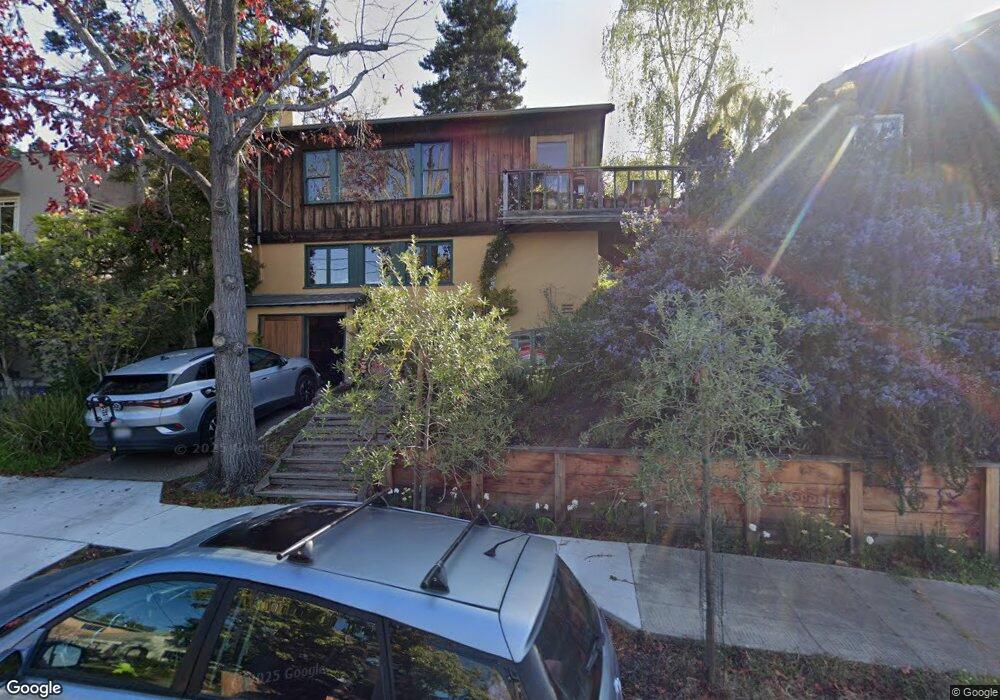
1185 Arch St Berkeley, CA 94708
Berkeley Hills NeighborhoodEstimated Value: $1,330,000 - $1,767,000
3
Beds
1
Bath
1,507
Sq Ft
$990/Sq Ft
Est. Value
About This Home
This home is located at 1185 Arch St, Berkeley, CA 94708 and is currently estimated at $1,491,719, approximately $989 per square foot. 1185 Arch St is a home located in Alameda County with nearby schools including Cragmont Elementary School, Berkeley Arts Magnet at Whittier School, and Washington Elementary School.
Ownership History
Date
Name
Owned For
Owner Type
Purchase Details
Closed on
Sep 26, 2022
Sold by
Barbara J Hazard Living Trust
Bought by
Hazard James G
Current Estimated Value
Purchase Details
Closed on
Mar 16, 1995
Sold by
Hazard Barbara J
Bought by
Hazard Barbara J
Create a Home Valuation Report for This Property
The Home Valuation Report is an in-depth analysis detailing your home's value as well as a comparison with similar homes in the area
Home Values in the Area
Average Home Value in this Area
Purchase History
| Date | Buyer | Sale Price | Title Company |
|---|---|---|---|
| Hazard James G | -- | None Listed On Document | |
| Hazard Barbara J | -- | -- |
Source: Public Records
Tax History
| Year | Tax Paid | Tax Assessment Tax Assessment Total Assessment is a certain percentage of the fair market value that is determined by local assessors to be the total taxable value of land and additions on the property. | Land | Improvement |
|---|---|---|---|---|
| 2025 | $9,858 | $496,029 | $140,873 | $355,156 |
| 2024 | $9,858 | $486,305 | $138,111 | $348,194 |
| 2023 | $9,587 | $476,770 | $135,403 | $341,367 |
| 2022 | $9,542 | $467,421 | $132,748 | $334,673 |
| 2021 | $9,541 | $458,258 | $130,146 | $328,112 |
| 2020 | $16,902 | $1,100,000 | $330,000 | $770,000 |
| 2019 | $8,564 | $444,667 | $126,286 | $318,381 |
| 2018 | $8,376 | $435,949 | $123,810 | $312,139 |
| 2017 | $8,068 | $427,403 | $121,383 | $306,020 |
| 2016 | $7,755 | $419,024 | $119,003 | $300,021 |
| 2015 | $7,629 | $412,732 | $117,216 | $295,516 |
| 2014 | $7,487 | $404,649 | $114,921 | $289,728 |
Source: Public Records
Map
Nearby Homes
- 2315 Eunice St
- 2121 Eunice St
- 1004 Cragmont Ave
- 1106 Cragmont Ave
- 2501 Rose Walk
- 962 Regal Rd
- 2686 Shasta Rd
- 1165 Cragmont Ave
- 1155 Keeler Ave
- 1950 Hopkins St
- 1110 Sterling Ave
- 1444 Walnut St
- 1515 Oxford St Unit 1D
- 826 Indian Rock Ave
- 1100 Miller Ave
- 1408 Henry St
- 1024 Grizzly Peak Blvd
- 1119 Miller Ave
- 1160 Miller Ave
- 1622 Scenic Ave
Your Personal Tour Guide
Ask me questions while you tour the home.