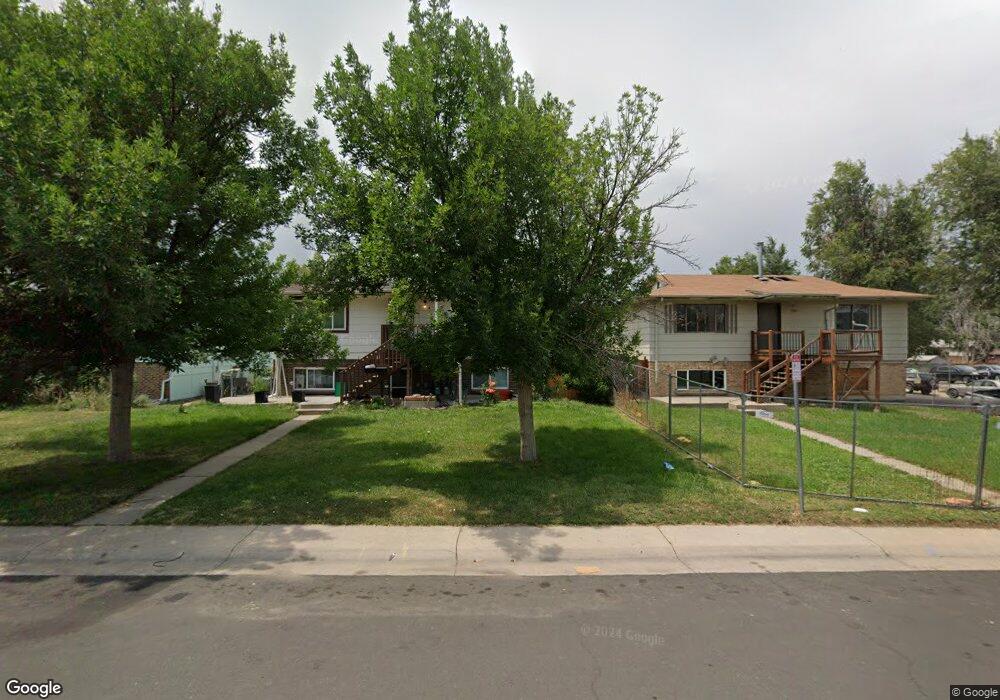
1185 Xenia St Denver, CO 80220
East Colfax NeighborhoodEstimated Value: $626,000 - $656,832
4
Beds
1
Bath
1,872
Sq Ft
$343/Sq Ft
Est. Value
About This Home
This home is located at 1185 Xenia St, Denver, CO 80220 and is currently estimated at $641,416, approximately $342 per square foot. 1185 Xenia St is a home located in Denver County with nearby schools including George Washington High School, Vanguard Classical School, and DSST: Montview High School.
Ownership History
Date
Name
Owned For
Owner Type
Purchase Details
Closed on
Jan 10, 2025
Sold by
Ramirez Claudia and Torres Cupertino
Bought by
Szymanski Isabel and Szymanski-Burgos Adam
Current Estimated Value
Home Financials for this Owner
Home Financials are based on the most recent Mortgage that was taken out on this home.
Original Mortgage
$553,110
Outstanding Balance
$549,269
Interest Rate
6.81%
Mortgage Type
New Conventional
Estimated Equity
$92,147
Purchase Details
Closed on
Sep 5, 2024
Sold by
Houck Susan A
Bought by
Elevated Equity Llc
Home Financials for this Owner
Home Financials are based on the most recent Mortgage that was taken out on this home.
Original Mortgage
$355,000
Interest Rate
6.47%
Mortgage Type
Construction
Purchase Details
Closed on
May 15, 2006
Sold by
Houck Susan
Bought by
Houck Susan A
Home Financials for this Owner
Home Financials are based on the most recent Mortgage that was taken out on this home.
Original Mortgage
$118,000
Interest Rate
7.47%
Mortgage Type
Fannie Mae Freddie Mac
Purchase Details
Closed on
May 3, 2006
Sold by
West Coast Realty Services Inc
Bought by
Houck Susan
Home Financials for this Owner
Home Financials are based on the most recent Mortgage that was taken out on this home.
Original Mortgage
$118,000
Interest Rate
7.47%
Mortgage Type
Fannie Mae Freddie Mac
Purchase Details
Closed on
Apr 28, 2005
Sold by
Ganga Mahaman
Bought by
West Coast Realty Services Inc
Purchase Details
Closed on
Apr 26, 2001
Sold by
Benson Sonja E
Bought by
Ganga Mahaman
Home Financials for this Owner
Home Financials are based on the most recent Mortgage that was taken out on this home.
Original Mortgage
$147,920
Interest Rate
7.75%
Purchase Details
Closed on
Nov 23, 1998
Sold by
Benson Stanley A and Benson Sonja E
Bought by
Benson Sonja E
Home Financials for this Owner
Home Financials are based on the most recent Mortgage that was taken out on this home.
Original Mortgage
$70,850
Interest Rate
6.9%
Purchase Details
Closed on
Jan 4, 1996
Sold by
Benson Stanley A
Bought by
Benson Stanley A and Benson Sonja E
Purchase Details
Closed on
Apr 14, 1995
Sold by
Benson Stanley A and Benson Sonja E
Bought by
Benson Stanley A
Home Financials for this Owner
Home Financials are based on the most recent Mortgage that was taken out on this home.
Original Mortgage
$60,800
Interest Rate
9.75%
Purchase Details
Closed on
Feb 6, 1993
Sold by
Johnston Steven M
Bought by
Js&B Partnership
Create a Home Valuation Report for This Property
The Home Valuation Report is an in-depth analysis detailing your home's value as well as a comparison with similar homes in the area
Home Values in the Area
Average Home Value in this Area
Purchase History
| Date | Buyer | Sale Price | Title Company |
|---|---|---|---|
| Szymanski Isabel | $618,000 | Htc (Heritage Title) | |
| Szymanski Isabel | $618,000 | Htc (Heritage Title) | |
| Elevated Equity Llc | $364,500 | Land Title | |
| Houck Susan A | -- | Land Title | |
| Houck Susan | $175,000 | Land Title | |
| West Coast Realty Services Inc | -- | -- | |
| Ganga Mahaman | $184,900 | -- | |
| Benson Sonja E | -- | Stewart Title | |
| Benson Stanley A | -- | -- | |
| Benson Stanley A | -- | North American Title Company | |
| Js&B Partnership | -- | Home Title Corporation |
Source: Public Records
Mortgage History
| Date | Status | Borrower | Loan Amount |
|---|---|---|---|
| Open | Szymanski Isabel | $553,110 | |
| Closed | Szymanski Isabel | $553,110 | |
| Previous Owner | Elevated Equity Llc | $355,000 | |
| Previous Owner | Houck Susan | $118,000 | |
| Previous Owner | Ganga Mahaman | $147,920 | |
| Previous Owner | Benson Sonja E | $70,850 | |
| Previous Owner | Benson Stanley A | $60,800 | |
| Closed | Ganga Mahaman | $36,980 |
Source: Public Records
Tax History Compared to Growth
Tax History
| Year | Tax Paid | Tax Assessment Tax Assessment Total Assessment is a certain percentage of the fair market value that is determined by local assessors to be the total taxable value of land and additions on the property. | Land | Improvement |
|---|---|---|---|---|
| 2024 | $2,691 | $33,980 | $10,960 | $23,020 |
| 2023 | $2,633 | $33,980 | $10,960 | $23,020 |
| 2022 | $1,893 | $23,810 | $8,490 | $15,320 |
| 2021 | $1,868 | $25,040 | $8,930 | $16,110 |
| 2020 | $1,985 | $26,760 | $6,700 | $20,060 |
| 2019 | $1,930 | $26,760 | $6,700 | $20,060 |
| 2018 | $1,477 | $19,090 | $6,750 | $12,340 |
| 2017 | $1,472 | $19,090 | $6,750 | $12,340 |
| 2016 | $1,178 | $14,440 | $4,474 | $9,966 |
| 2015 | $1,128 | $14,440 | $4,474 | $9,966 |
| 2014 | $745 | $8,970 | $3,980 | $4,990 |
Source: Public Records
Map
Nearby Homes
- 1179 Xenia St
- 1175 Xenia St
- 1167 Xenia St
- 1186 Xenia St
- 1180 Xenia St
- 1176 Xenia St
- 1190 Xenia St
- 1200 Xanthia St
- 8805 E 12th Ave
- 1166 Xenia St
- 1210 Xanthia St
- 1160 Xenia St
- 1220 Xanthia St
- 1179 Xanthia St
- 1185 Xanthia St
- 1171 Xanthia St
- 1195 Yosemite St
- 1230 Xanthia St
- 1175 Yosemite St
- 1156 Xenia St