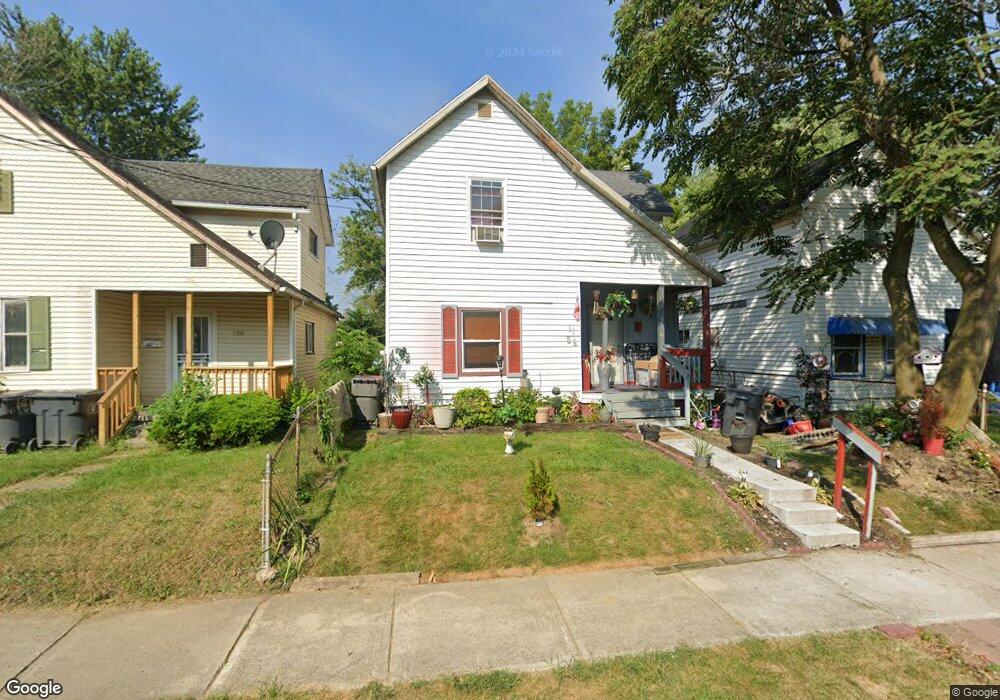
1186 S Union St Lima, OH 45804
Southside Lima NeighborhoodEstimated Value: $43,000 - $69,399
3
Beds
1
Bath
998
Sq Ft
$57/Sq Ft
Est. Value
About This Home
This home is located at 1186 S Union St, Lima, OH 45804 and is currently estimated at $56,850, approximately $56 per square foot. 1186 S Union St is a home located in Allen County with nearby schools including Unity Elementary School, Lima North Middle School, and Lima West Middle School.
Ownership History
Date
Name
Owned For
Owner Type
Purchase Details
Closed on
Jan 9, 2009
Sold by
Meyers Joseph E and Young Joel D
Bought by
Parks Kim
Current Estimated Value
Purchase Details
Closed on
Oct 10, 2007
Sold by
Meyers Joseph E and Young Joel D
Bought by
Parks Kim
Purchase Details
Closed on
Jan 30, 2001
Sold by
Laman Russel C
Bought by
Frye Robert L and Frye Janice
Home Financials for this Owner
Home Financials are based on the most recent Mortgage that was taken out on this home.
Original Mortgage
$31,200
Interest Rate
7.43%
Mortgage Type
New Conventional
Purchase Details
Closed on
Apr 25, 1994
Sold by
Simpson Hiram and Simpson Christine
Bought by
Laman Russell C
Purchase Details
Closed on
Apr 20, 1993
Sold by
Harshbarger John D
Bought by
Simpson Hiram and Simpson Christine
Purchase Details
Closed on
Aug 23, 1989
Bought by
Harshbarger John D
Create a Home Valuation Report for This Property
The Home Valuation Report is an in-depth analysis detailing your home's value as well as a comparison with similar homes in the area
Home Values in the Area
Average Home Value in this Area
Purchase History
| Date | Buyer | Sale Price | Title Company |
|---|---|---|---|
| Parks Kim | $15,000 | Attorney | |
| Parks Kim | $15,000 | None Available | |
| Frye Robert L | $39,000 | -- | |
| Laman Russell C | $800 | -- | |
| Simpson Hiram | $600 | -- | |
| Harshbarger John D | $5,500 | -- |
Source: Public Records
Mortgage History
| Date | Status | Borrower | Loan Amount |
|---|---|---|---|
| Previous Owner | Frye Robert L | $31,200 |
Source: Public Records
Tax History Compared to Growth
Tax History
| Year | Tax Paid | Tax Assessment Tax Assessment Total Assessment is a certain percentage of the fair market value that is determined by local assessors to be the total taxable value of land and additions on the property. | Land | Improvement |
|---|---|---|---|---|
| 2024 | $311 | $6,940 | $810 | $6,130 |
| 2023 | $333 | $6,620 | $770 | $5,850 |
| 2022 | $333 | $6,620 | $770 | $5,850 |
| 2021 | $350 | $6,620 | $770 | $5,850 |
| 2020 | $290 | $4,660 | $770 | $3,890 |
| 2019 | $290 | $4,660 | $770 | $3,890 |
| 2018 | $289 | $4,660 | $770 | $3,890 |
| 2017 | $291 | $4,660 | $770 | $3,890 |
| 2016 | $296 | $4,660 | $770 | $3,890 |
| 2015 | $290 | $4,660 | $770 | $3,890 |
| 2014 | $310 | $5,050 | $810 | $4,240 |
| 2013 | $303 | $5,050 | $810 | $4,240 |
Source: Public Records
Map
Nearby Homes
- 1189 S Main St
- 1147 S Union St
- 516 Catalpa Ave
- 639 E 4th St
- 640 E 4th St
- 839 Saint Johns Ave
- 306 E Vine St
- 600 Dingledine Ave
- 865 E 4th St
- 861 E 4th St
- 1008 Fairview Ave
- 785 Holly St
- 1093 S Sugar St
- 706 E Kibby St
- 720 S Metcalf St
- 380 S Pine St
- 711 W Kibby St
- 520 Orena Ave
- 1900 Garland Ave
- 11 Unit Multi Family and Sfh