
Seller's Agent in 2025
Jason Lewis
Your Castle Real Estate Inc
(720) 441-3677
1 in this area
86 Total Sales

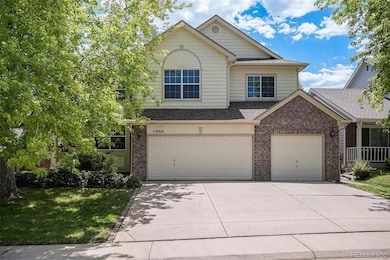
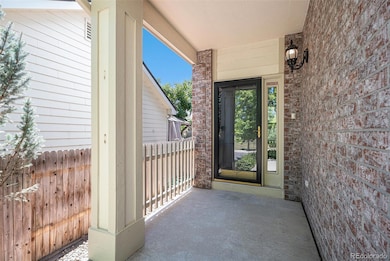

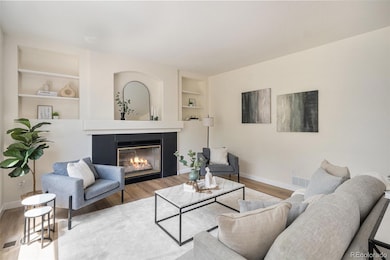
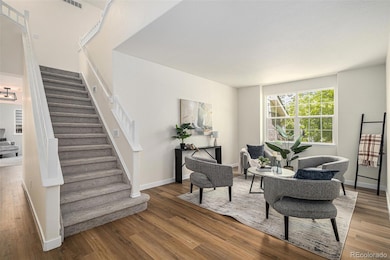

Welcome to your fully renovated 3,547 SF, 4-bedroom, 4-bathroom home in the sought-after West Belleview neighborhood of Littleton, CO. This move-in-ready residence offers an open, light-filled layout designed for modern living. The updated chef’s kitchen boasts custom cabinetry, granite countertops, a spacious kitchen island, a 3-person breakfast bar, and a premium stainless steel appliance package. The main floor features a home office that provides a productive space, an updated powder room, and multiple inviting living areas, including a spacious dining area perfect for entertaining, a comfortable family room, and a living room with a cozy fireplace and direct access to the deck, creating the ideal setting for both daily life and special gatherings.
The upper floor boasts an oversized primary suite featuring an en-suite bathroom with a custom double vanity, walk-in shower, soaking tub, and a walk-in closet. Three generously sized secondary bedrooms offer versatility for guests, a media room, or hobbies. An updated full bathroom with a walk-in shower and a bright, versatile sitting room perfect as a reading nook, play area, or quiet retreat.
The lower level offers added versatility with a bonus room and a full bathroom with a walk-in shower for added convenience. A spacious recreation area completes the level, providing the perfect setting for relaxation, game nights, or entertaining guests.
Additional upgrades include a composite roof with a 5-year warranty, updated flooring, fresh interior paint, and modern lighting and fixtures. Thoughtful touches throughout enhance the home’s overall comfort and style.
This home perfectly balances suburban tranquility with urban convenience. Residents benefit from proximity to scenic parks and green spaces, as well as easy access to schools, trails, shopping, dining, and quick connections to C-470.
Last Agent to Sell the Property
Your Castle Real Estate Inc Brokerage Email: jason@ecospace.com,303-949-8662 License #100031034 Listed on: 07/10/2025
| Date | Type | Sale Price | Title Company |
|---|---|---|---|
| Special Warranty Deed | $790,000 | Homestead Title & Escrow | |
| Special Warranty Deed | $650,000 | None Listed On Document | |
| Warranty Deed | $350,000 | Land Title Guarantee Company | |
| Warranty Deed | $235,132 | North American Title Co |
| Date | Status | Loan Amount | Loan Type |
|---|---|---|---|
| Open | $490,000 | New Conventional | |
| Previous Owner | $645,600 | Construction | |
| Previous Owner | $200,000 | Fannie Mae Freddie Mac | |
| Previous Owner | $205,132 | No Value Available |
| Date | Event | Price | List to Sale | Price per Sq Ft |
|---|---|---|---|---|
| 09/15/2025 09/15/25 | Sold | $790,000 | -1.3% | $283 / Sq Ft |
| 07/31/2025 07/31/25 | Price Changed | $800,000 | -2.4% | $286 / Sq Ft |
| 07/10/2025 07/10/25 | For Sale | $820,000 | -- | $294 / Sq Ft |
| Year | Tax Paid | Tax Assessment Tax Assessment Total Assessment is a certain percentage of the fair market value that is determined by local assessors to be the total taxable value of land and additions on the property. | Land | Improvement |
|---|---|---|---|---|
| 2024 | $3,344 | $40,846 | $11,633 | $29,213 |
| 2023 | $3,344 | $40,846 | $11,633 | $29,213 |
| 2022 | $3,150 | $37,908 | $9,821 | $28,087 |
| 2021 | $3,187 | $39,000 | $10,104 | $28,896 |
| 2020 | $2,713 | $34,336 | $7,649 | $26,687 |
| 2019 | $2,685 | $34,336 | $7,649 | $26,687 |
| 2018 | $2,399 | $30,681 | $9,139 | $21,542 |
| 2017 | $2,191 | $30,681 | $9,139 | $21,542 |
| 2016 | $3,062 | $31,640 | $8,429 | $23,211 |
| 2015 | $2,668 | $31,640 | $8,429 | $23,211 |
| 2014 | $2,668 | $25,835 | $6,190 | $19,645 |
Seller's Agent in 2025
Jason Lewis
Your Castle Real Estate Inc
(720) 441-3677
1 in this area
86 Total Sales
Buyer's Agent in 2025
Luke Corbitt
Slifer Smith and Frampton Real Estate
(303) 949-8104
1 in this area
121 Total Sales
Source: REcolorado®
MLS Number: 6945535
APN: 59-171-12-011
Disclaimer: Certain information contained herein is derived from information provided by parties other than Homes.com. All information provided is deemed reliable, but is not guaranteed to be accurate and should be independently verified.
![]() The content relating to real estate for sale in this Web site comes in part from the Internet Data eXchange (“IDX”) program of METROLIST, INC., DBA RECOLORADO®. Real estate listings held by brokers other than Ten-X are marked with the IDX Logo. This information is being provided for the consumers’ personal, non-commercial use and may not be used for any other purpose. All information subject to change and should be independently verified.
The content relating to real estate for sale in this Web site comes in part from the Internet Data eXchange (“IDX”) program of METROLIST, INC., DBA RECOLORADO®. Real estate listings held by brokers other than Ten-X are marked with the IDX Logo. This information is being provided for the consumers’ personal, non-commercial use and may not be used for any other purpose. All information subject to change and should be independently verified.
This publication is designed to provide information with regard to the subject matter covered. It is displayed with the understanding that the publisher and authors are not engaged in rendering real estate, legal, accounting, tax, or other professional services and that the publisher and authors are not offering such advice in this publication. If real estate, legal, or other expert assistance is required, the services of a competent, professional person should be sought.
The information contained in this publication is subject to change without notice. METROLIST, INC., DBA RECOLORADO MAKES NO WARRANTY OF ANY KIND WITH REGARD TO THIS MATERIAL, INCLUDING, BUT NOT LIMITED TO, THE IMPLIED WARRANTIES OF MERCHANTABILITY AND FITNESS FOR A PARTICULAR PURPOSE. METROLIST, INC., DBA RECOLORADO SHALL NOT BE LIABLE FOR ERRORS CONTAINED HEREIN OR FOR ANY DAMAGES IN CONNECTION WITH THE FURNISHING, PERFORMANCE, OR USE OF THIS MATERIAL.
PUBLISHER’S NOTICE: All real estate advertised herein is subject to the Federal Fair Housing Act and the Colorado Fair Housing Act, which Acts make it illegal to make or publish any advertisement that indicates any preference, limitation, or discrimination based on race, color, religion, sex, handicap, familial status, or national origin.
METROLIST, INC., DBA RECOLORADO will not knowingly accept any advertising for real estate that is in violation of the law. All persons are hereby informed that all dwellings advertised are available on an equal opportunity basis.
© 2025 METROLIST, INC., DBA RECOLORADO® – All Rights Reserved. 6455 S. Yosemite St., Suite 500 Greenwood Village, CO 80111 USA
ALL RIGHTS RESERVED WORLDWIDE. No part of this publication may be reproduced, adapted, translated, stored in a retrieval system or transmitted in any form or by any means, electronic, mechanical, photocopying, recording, or otherwise, without the prior written permission of the publisher. The information contained herein including but not limited to all text, photographs, digital images, virtual tours, may be seeded and monitored for protection and tracking.