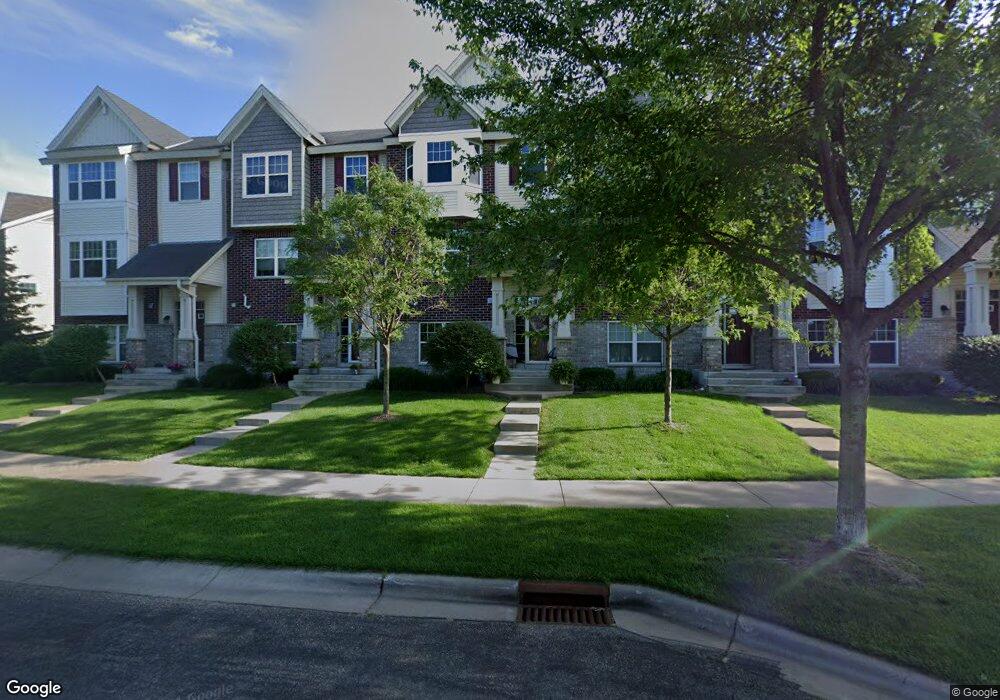
11879 Emery Village Dr N Unit 2505 Champlin, MN 55316
Estimated Value: $325,000 - $339,000
3
Beds
4
Baths
1,798
Sq Ft
$185/Sq Ft
Est. Value
About This Home
This home is located at 11879 Emery Village Dr N Unit 2505, Champlin, MN 55316 and is currently estimated at $332,439, approximately $184 per square foot. 11879 Emery Village Dr N Unit 2505 is a home located in Hennepin County with nearby schools including Champlin-Brooklyn Park Academy, Jackson Middle School, and Champlin Park High School.
Ownership History
Date
Name
Owned For
Owner Type
Purchase Details
Closed on
May 29, 2019
Sold by
Hadrava Jesse D and Hadrava Sara
Bought by
Broh Kaibeh and Broh Samuel T
Current Estimated Value
Home Financials for this Owner
Home Financials are based on the most recent Mortgage that was taken out on this home.
Original Mortgage
$269,037
Outstanding Balance
$239,547
Interest Rate
4.75%
Mortgage Type
FHA
Estimated Equity
$92,892
Purchase Details
Closed on
Oct 16, 2017
Sold by
Fletcher Pamela Jean and Fletcher Pamela
Bought by
Hadrava Jesse D
Home Financials for this Owner
Home Financials are based on the most recent Mortgage that was taken out on this home.
Original Mortgage
$231,597
Interest Rate
3.37%
Mortgage Type
FHA
Purchase Details
Closed on
Jun 18, 2010
Sold by
Centex Homes Of Mn
Bought by
Fletcher Paul and Fletcher Pamela
Create a Home Valuation Report for This Property
The Home Valuation Report is an in-depth analysis detailing your home's value as well as a comparison with similar homes in the area
Home Values in the Area
Average Home Value in this Area
Purchase History
| Date | Buyer | Sale Price | Title Company |
|---|---|---|---|
| Broh Kaibeh | $274,000 | Modern Title Llc | |
| Hadrava Jesse D | $235,800 | None Available | |
| Fletcher Paul | $204,900 | -- |
Source: Public Records
Mortgage History
| Date | Status | Borrower | Loan Amount |
|---|---|---|---|
| Open | Broh Kaibeh | $269,037 | |
| Previous Owner | Hadrava Jesse D | $231,597 |
Source: Public Records
Tax History Compared to Growth
Tax History
| Year | Tax Paid | Tax Assessment Tax Assessment Total Assessment is a certain percentage of the fair market value that is determined by local assessors to be the total taxable value of land and additions on the property. | Land | Improvement |
|---|---|---|---|---|
| 2024 | $3,813 | $332,400 | $17,900 | $314,500 |
| 2023 | $3,813 | $338,300 | $24,200 | $314,100 |
| 2022 | $3,301 | $324,000 | $26,000 | $298,000 |
| 2021 | $3,050 | $272,000 | $26,000 | $246,000 |
| 2020 | $3,027 | $252,000 | $21,000 | $231,000 |
| 2019 | $2,969 | $245,000 | $21,000 | $224,000 |
| 2018 | $2,768 | $237,000 | $13,000 | $224,000 |
| 2017 | $2,543 | $202,000 | $11,000 | $191,000 |
| 2016 | $2,398 | $186,000 | $13,000 | $173,000 |
| 2015 | $2,391 | $185,000 | $13,000 | $172,000 |
| 2014 | -- | $169,000 | $13,000 | $156,000 |
Source: Public Records
Map
Nearby Homes
- 11800 Emery Village Dr N
- 8320 Emery Pkwy N
- 8333 Emery Pkwy N
- 11765 Emery Village Dr N
- 11750 Emery Village Dr N
- 11914 Emery Village Dr N
- 11918 Utah Ave N
- 11632 Utah Ave N
- 11932 Winnetka Ave N
- 8101 116th Ave N
- 7715 118th Ave N
- 7710 118th Ave N
- 11651 Elmwood Ave N
- 11612 Elmwood Ave N
- 11477 Marketplace Dr N
- 8124 115th Ln N
- 908 Ludwig Ave N
- 12136 Yukon Ave N
- 8400 122nd Ave N
- 1203 Heard Ave
- 11871 Emery Village Dr N
- 11871 11871 Emery Village Dr N
- 11877 11877 Emery Village Dr N
- 11879 11879 Emery Village-Drive-n
- 11871 11871 Emery Village-Drive-n
- 11877 11877 Emery Village Dr
- 11871 Emery Village Dr N Unit 2501
- 11879 Emery Village Dr N
- 11877 Emery Village Dr N
- 11875 Emery Village Dr N
- 11873 Emery Village Dr N Unit 2502
- 11870 11870 Emery Village-Drive-n
- 11872 11872 Emery Village-Drive-n
- 11872 11872 Emery Village Dr N
- 11848 11848 Emery Village-Drive-n
- 11903 11903 Emery Village Dr N
- 11807 Emery Village Dr N Unit 2604
- 11909 Emery Village Dr N Unit NO2301
- 11854 11854 Emery Village-Drive-n
- 11801 11801 N Emery Village Dr N