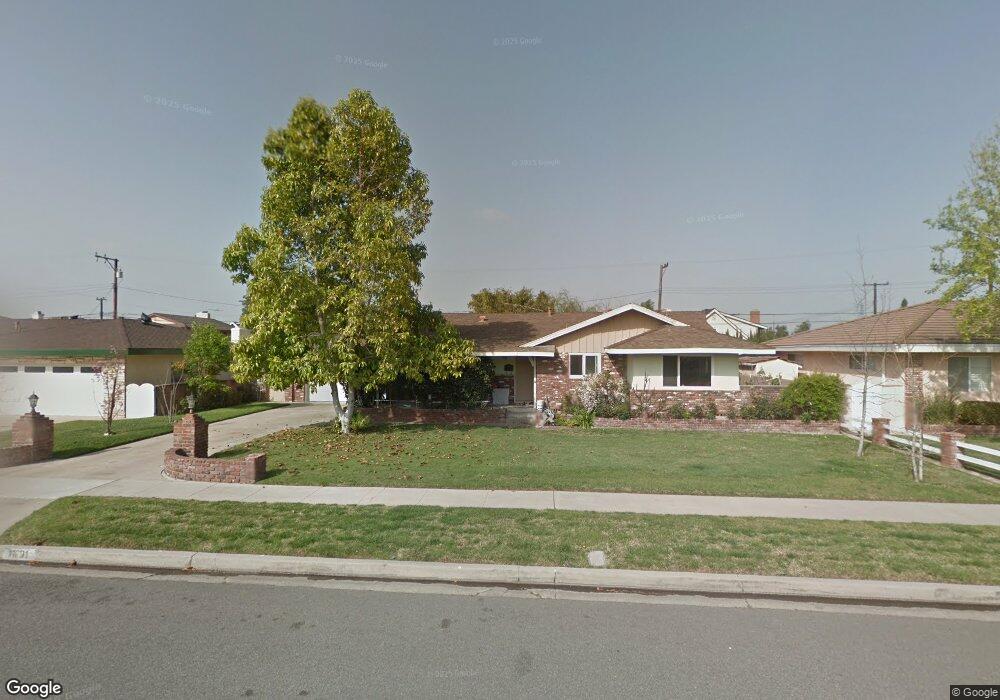
11891 Della Ln Garden Grove, CA 92840
Estimated Value: $961,000 - $1,066,000
3
Beds
2
Baths
1,311
Sq Ft
$768/Sq Ft
Est. Value
About This Home
This home is located at 11891 Della Ln, Garden Grove, CA 92840 and is currently estimated at $1,006,940, approximately $768 per square foot. 11891 Della Ln is a home located in Orange County with nearby schools including Parkview Elementary, Lake Intermediate School, and Garden Grove High School.
Ownership History
Date
Name
Owned For
Owner Type
Purchase Details
Closed on
Jul 30, 2002
Sold by
Tran Jacqueline Anh Dao
Bought by
Pham Thinh Ky and Tran Jacqueline Anh Dao
Current Estimated Value
Home Financials for this Owner
Home Financials are based on the most recent Mortgage that was taken out on this home.
Original Mortgage
$252,000
Outstanding Balance
$106,405
Interest Rate
6.52%
Estimated Equity
$900,535
Purchase Details
Closed on
Sep 24, 1998
Sold by
Emma Robert A
Bought by
Emma Natalie L
Home Financials for this Owner
Home Financials are based on the most recent Mortgage that was taken out on this home.
Original Mortgage
$156,000
Interest Rate
6.88%
Purchase Details
Closed on
Sep 4, 1998
Sold by
Natalie Fascitelli and Natalie L
Bought by
Tran Jacqueline Anh Dao
Home Financials for this Owner
Home Financials are based on the most recent Mortgage that was taken out on this home.
Original Mortgage
$156,000
Interest Rate
6.88%
Create a Home Valuation Report for This Property
The Home Valuation Report is an in-depth analysis detailing your home's value as well as a comparison with similar homes in the area
Home Values in the Area
Average Home Value in this Area
Purchase History
| Date | Buyer | Sale Price | Title Company |
|---|---|---|---|
| Pham Thinh Ky | -- | First American Title Co | |
| Emma Natalie L | -- | Benefit Land Title Company | |
| Tran Jacqueline Anh Dao | -- | Benefit Land Title Company | |
| Tran Jacqueline Anh Dao | $195,000 | Benefit Land Title Company |
Source: Public Records
Mortgage History
| Date | Status | Borrower | Loan Amount |
|---|---|---|---|
| Open | Pham Thinh Ky | $252,000 | |
| Closed | Tran Jacqueline Anh Dao | $156,000 |
Source: Public Records
Tax History Compared to Growth
Tax History
| Year | Tax Paid | Tax Assessment Tax Assessment Total Assessment is a certain percentage of the fair market value that is determined by local assessors to be the total taxable value of land and additions on the property. | Land | Improvement |
|---|---|---|---|---|
| 2025 | $3,909 | $305,692 | $216,217 | $89,475 |
| 2024 | $3,909 | $299,699 | $211,978 | $87,721 |
| 2023 | $3,834 | $293,823 | $207,822 | $86,001 |
| 2022 | $3,747 | $288,062 | $203,747 | $84,315 |
| 2021 | $3,694 | $282,414 | $199,752 | $82,662 |
| 2020 | $3,649 | $279,519 | $197,704 | $81,815 |
| 2019 | $3,600 | $274,039 | $193,828 | $80,211 |
| 2018 | $3,512 | $268,666 | $190,027 | $78,639 |
| 2017 | $3,474 | $263,399 | $186,301 | $77,098 |
| 2016 | $3,304 | $258,235 | $182,648 | $75,587 |
| 2015 | $3,260 | $254,357 | $179,905 | $74,452 |
| 2014 | $3,183 | $249,375 | $176,381 | $72,994 |
Source: Public Records
Map
Nearby Homes
- 11252 Chapman Ave
- 10882 Chapman Ave
- 2227 S Atlanta St
- 11102 Avolencia Place
- 12071 Diane St
- 12256 Lesley St
- 12332 Euclid St
- 11081 Iris Dr
- 11552 9th St
- 11762 Gary St
- 11441 Dolan St
- 11301 Euclid St Unit 60
- 11301 Euclid St Unit 21
- 11731 Rose Dr
- 405 13181 Lampson
- 10691 Perrin Dr
- 11052 Peppertree Ln
- 12555 S Euclid St Unit 32
- 12600 Euclid St Unit 19
- 12555 Euclid St Unit 79
- 11901 Della Ln
- 11861 Della Ln Unit G
- 11121 Bixler Cir
- 11122 Bixler Cir
- 11111 Bixler Cir
- 11851 Della Ln
- 11921 Della Ln Unit A
- 11921 Della Ln
- 11892 Della Ln
- 11882 Della Ln
- 11112 Bixler Cir
- 11101 Bixler Cir
- 11912 Della Ln
- 11852 Della Ln
- 11102 Bixler Cir
- 11941 S Della Ln Unit Room 3
- 11941 S Della Ln Unit 2
- 11121 Lavender Ln
- 11941 Della Ln
- 11841 Della Ln