Estimated Value: $108,459 - $143,000
3
Beds
2
Baths
1,464
Sq Ft
$86/Sq Ft
Est. Value
About This Home
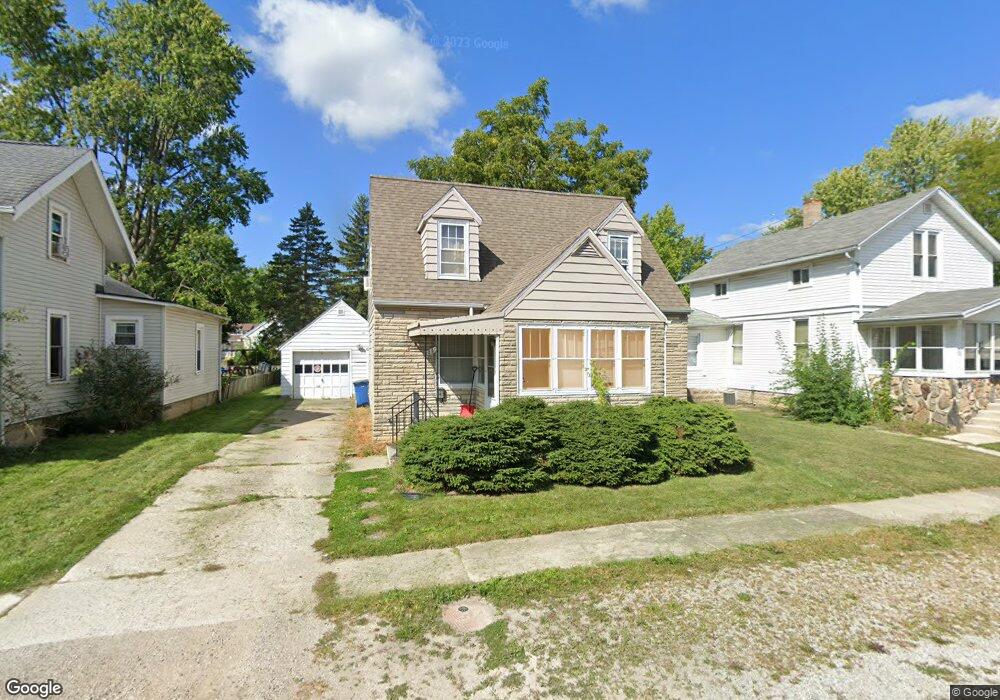
This home is located at 119 Baker St, Bryan, OH 43506 and is currently estimated at $125,865, approximately $85 per square foot. 119 Baker St is a home located in Williams County with nearby schools including Bryan Elementary PK-5, Washington Elementary School, and Bryan Middle School/High School.
Ownership History
Date
Name
Owned For
Owner Type
Purchase Details
Closed on
Dec 31, 2007
Sold by
Hsbc Bank Usa Na
Bought by
Motter David and Motter David J
Current Estimated Value
Purchase Details
Closed on
Sep 26, 2007
Sold by
Zehr Eric D
Bought by
Hsbc Bank Usa N A
Purchase Details
Closed on
Mar 9, 2005
Sold by
Weaver Kevin T and Weaver Carla S
Bought by
Zehr Eric D and Zehr Amanda J
Home Financials for this Owner
Home Financials are based on the most recent Mortgage that was taken out on this home.
Original Mortgage
$69,000
Interest Rate
7%
Mortgage Type
Adjustable Rate Mortgage/ARM
Purchase Details
Closed on
Sep 27, 1999
Sold by
Weaver Schmuhl C and Weaver Kevin O
Bought by
Weaver Kevin T and Weaver Carla S
Purchase Details
Closed on
Dec 29, 1997
Sold by
Schmuhl Thomas P
Bought by
Weaver Schmuhl C and Weaver Kevin O
Purchase Details
Closed on
Oct 27, 1995
Bought by
Schmuhl Thomas P
Create a Home Valuation Report for This Property
The Home Valuation Report is an in-depth analysis detailing your home's value as well as a comparison with similar homes in the area
Home Values in the Area
Average Home Value in this Area
Purchase History
| Date | Buyer | Sale Price | Title Company |
|---|---|---|---|
| Motter David | $63,000 | Federated Land Title Agency | |
| Hsbc Bank Usa N A | $53,000 | None Available | |
| Zehr Eric D | $89,000 | None Available | |
| Weaver Kevin T | $55,000 | -- | |
| Weaver Schmuhl C | $55,000 | -- | |
| Schmuhl Thomas P | $52,000 | -- |
Source: Public Records
Mortgage History
| Date | Status | Borrower | Loan Amount |
|---|---|---|---|
| Previous Owner | Zehr Eric D | $69,000 | |
| Previous Owner | Zehr Eric D | $20,000 |
Source: Public Records
Tax History Compared to Growth
Tax History
| Year | Tax Paid | Tax Assessment Tax Assessment Total Assessment is a certain percentage of the fair market value that is determined by local assessors to be the total taxable value of land and additions on the property. | Land | Improvement |
|---|---|---|---|---|
| 2024 | $1,178 | $25,900 | $3,150 | $22,750 |
| 2023 | $1,178 | $22,790 | $3,120 | $19,670 |
| 2022 | $1,149 | $22,790 | $3,120 | $19,670 |
| 2021 | $1,148 | $22,790 | $3,120 | $19,670 |
| 2020 | $1,030 | $19,820 | $2,700 | $17,120 |
| 2019 | $1,022 | $19,820 | $2,700 | $17,120 |
| 2018 | $907 | $19,820 | $2,700 | $17,120 |
| 2017 | $831 | $16,040 | $2,770 | $13,270 |
| 2016 | $795 | $16,040 | $2,770 | $13,270 |
| 2015 | $804 | $16,040 | $2,770 | $13,270 |
| 2014 | $804 | $15,580 | $2,700 | $12,880 |
| 2013 | $807 | $15,580 | $2,700 | $12,880 |
Source: Public Records
Map
Nearby Homes
- 723 W High St
- 134 N Vine St
- 826 Parkview Ave
- 000 C R C (West 828)
- 000 C R C (East 787)
- 228 N Beech St
- 817 Oakwood Ave
- 0 Lynn St Unit 6110702
- 403 N Walnut St
- 615 S Portland St
- 422 S Main St
- 502 Willmore Dr
- 321 N Cherry St
- 509 S Lynn St
- 110 N Cherry St
- 222 N Cherry St
- 630 Center Ridge Rd
- 13673 County Rd E
- 724 S Main St
- 730 S Main St