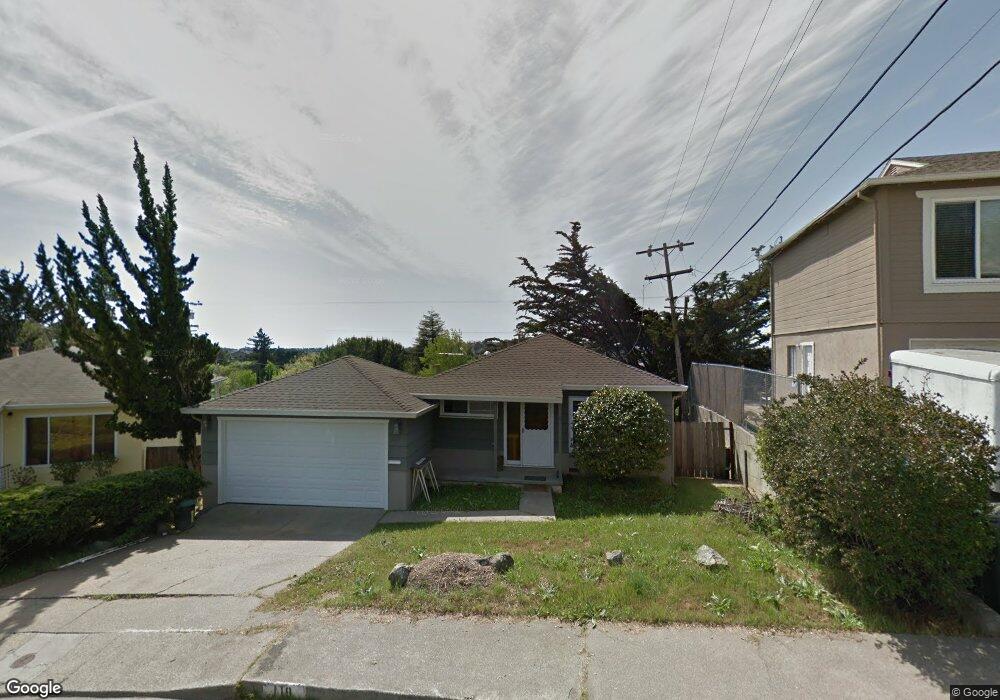
119 El Poco Place Vallejo, CA 94589
West Vallejo NeighborhoodEstimated Value: $396,000 - $523,000
3
Beds
1
Bath
1,000
Sq Ft
$454/Sq Ft
Est. Value
About This Home
This home is located at 119 El Poco Place, Vallejo, CA 94589 and is currently estimated at $453,903, approximately $453 per square foot. 119 El Poco Place is a home located in Solano County with nearby schools including Johnston Cooper Elementary, Vallejo High School, and Caliber: ChangeMakers Academy.
Ownership History
Date
Name
Owned For
Owner Type
Purchase Details
Closed on
Nov 2, 2012
Sold by
Boguslawski Barbara A and Murphy Eric M
Bought by
Boguslawski Barbara A and Murphy Eric M
Current Estimated Value
Home Financials for this Owner
Home Financials are based on the most recent Mortgage that was taken out on this home.
Original Mortgage
$241,500
Outstanding Balance
$105,478
Interest Rate
3.34%
Mortgage Type
New Conventional
Estimated Equity
$348,425
Purchase Details
Closed on
Jun 30, 2011
Sold by
Freeman Nina L
Bought by
Bac Home Loans Servicing Lp
Purchase Details
Closed on
Nov 6, 2000
Sold by
Swanson Catherine M and Harrington Eleanor A
Bought by
Murphy Eric M and Boguslawski Barbara A
Home Financials for this Owner
Home Financials are based on the most recent Mortgage that was taken out on this home.
Original Mortgage
$178,100
Interest Rate
7.88%
Purchase Details
Closed on
Feb 22, 1996
Sold by
Fenton Frances D
Bought by
Fenton Donald A and Fenton Frances D
Create a Home Valuation Report for This Property
The Home Valuation Report is an in-depth analysis detailing your home's value as well as a comparison with similar homes in the area
Home Values in the Area
Average Home Value in this Area
Purchase History
| Date | Buyer | Sale Price | Title Company |
|---|---|---|---|
| Boguslawski Barbara A | -- | Old Republic Title Company | |
| Bac Home Loans Servicing Lp | $492,311 | Landsafe Default Inc | |
| Murphy Eric M | $187,500 | Fidelity National Title Co | |
| Fenton Donald A | -- | -- |
Source: Public Records
Mortgage History
| Date | Status | Borrower | Loan Amount |
|---|---|---|---|
| Open | Boguslawski Barbara A | $241,500 | |
| Previous Owner | Murphy Eric M | $178,100 |
Source: Public Records
Tax History
| Year | Tax Paid | Tax Assessment Tax Assessment Total Assessment is a certain percentage of the fair market value that is determined by local assessors to be the total taxable value of land and additions on the property. | Land | Improvement |
|---|---|---|---|---|
| 2025 | $4,186 | $282,522 | $60,266 | $222,256 |
| 2024 | $4,186 | $276,984 | $59,085 | $217,899 |
| 2023 | $3,935 | $271,554 | $57,927 | $213,627 |
| 2022 | $3,838 | $266,231 | $56,793 | $209,438 |
| 2021 | $3,752 | $261,012 | $55,680 | $205,332 |
| 2020 | $3,764 | $258,337 | $55,110 | $203,227 |
| 2019 | $3,646 | $253,273 | $54,030 | $199,243 |
| 2018 | $3,409 | $248,308 | $52,971 | $195,337 |
| 2017 | $3,253 | $243,440 | $51,933 | $191,507 |
| 2016 | $2,682 | $238,667 | $50,915 | $187,752 |
| 2015 | $2,634 | $234,000 | $44,000 | $190,000 |
| 2014 | $2,041 | $181,000 | $36,000 | $145,000 |
Source: Public Records
Map
Nearby Homes
- 136 Mesa Verde St
- 925 N Camino Alto
- 1115 Sereno Dr
- 161 Serra Dr
- 1214 Sereno Dr
- 208 Del Mar Ave
- 108 Hermosa Ave
- 1268 Sereno Dr
- 108 San Gorgonio Ave
- 34 Hermosa Ave
- 208 Los Gatos Ave
- 2525 Alameda St
- 401 Valle Vista Ave
- 389 Valle Vista Ave
- 165 Oddstad Dr Unit 10
- 165 Oddstad Dr Unit 67
- 1201 Valle Vista Ave
- 110 Fremont St
- 1333 N Camino Alto None Unit 114
- 436 Washington St
- 125 El Poco Place
- 113 El Poco Place
- 131 El Poco Place
- 232 De Anza Dr
- 107 El Poco Place
- 308 De Anza Dr
- 108 El Poco Place
- 124 El Poco Place
- 224 De Anza Dr
- 137 El Poco Place
- 314 De Anza Dr
- 215 San Marino Ave
- 130 El Poco Place
- 221 San Marino Ave
- 102 El Poco Place
- 136 El Poco Place
- 143 El Poco Place
- 214 De Anza Dr
- 318 De Anza Dr
- 309 De Anza Dr
Your Personal Tour Guide
Ask me questions while you tour the home.