
Seller's Agent in 2025
Joshua Winn
Realty One Group Next Level
(603) 391-5503
1 in this area
139 Total Sales
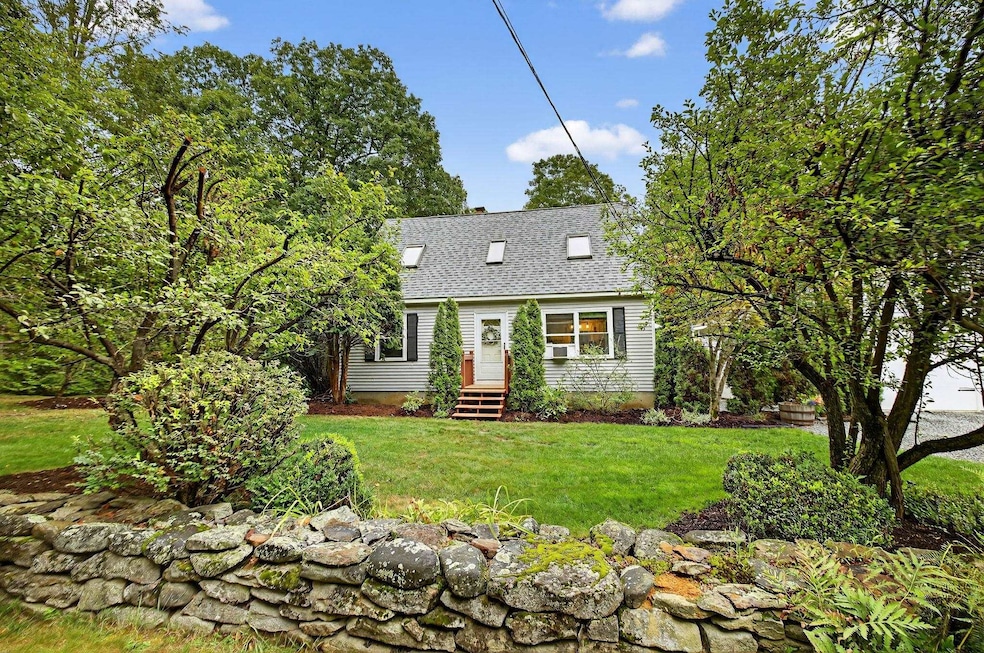
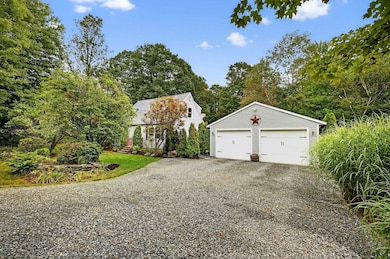
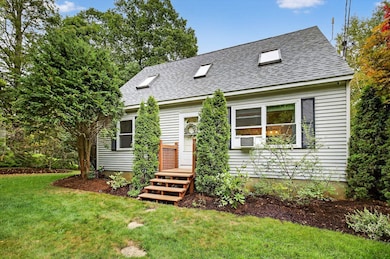
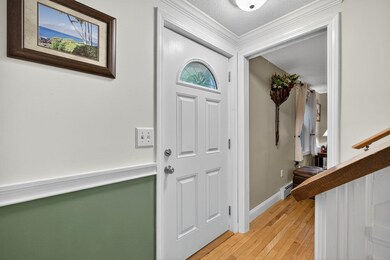
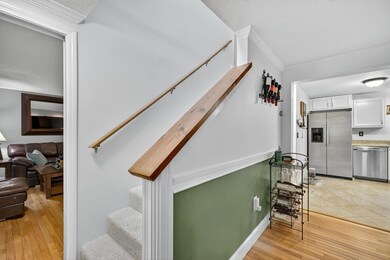
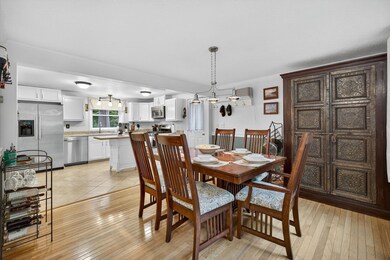
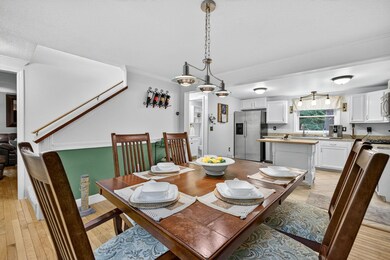
Welcome to your private retreat in the heart of Central NH. This meticulously maintained 3 bedroom 2 bathroom Cape sits on a beautiful 3.21 acre rectangular lot on a quiet street. Inside, you will find hardwood floors and tile throughout, adding charm that vinyl plank simply could not match. The first floor features an open concept kitchen and dining setup, complete with stainless steel appliances and a view of the serene backyard from your kitchen window. If accessibility is a priority, the room being used as an office currently is a first floor bedroom with a closet, just around the corner from the cozy living room with an intuitive layout. Upstairs you have 2 spacious bedrooms with skylights that let the sun gleam off the wood floors, lighting is truly optional during the day. The finished basement is separated into 2 different spaces, currently used as a den/storage one one side, and a workout/movie room on the other. The detached garage is well-lit and heated, making this a dream for the handyman or car enthusiast. Stepping outside, you have 10 Blueberry bushes, 4 Carmine Jewel's Dwarf Cherry bushes, a chicken coup, stunning fire pit, and a deck to grill on. This home is the epitome of what it is like to live in New Hampshire. Despite its private setting, this home is centrally located, being a short drive to Concord and the necessities, and under an hour to Lake Winni for when you yearn for some time on the water. Schedule your showing today!
| Date | Type | Sale Price | Title Company |
|---|---|---|---|
| Warranty Deed | $480,000 | -- | |
| Deed | $214,500 | -- | |
| Deed | $217,000 | -- | |
| Warranty Deed | $156,800 | -- | |
| Warranty Deed | $88,000 | -- |
| Date | Status | Loan Amount | Loan Type |
|---|---|---|---|
| Open | $471,306 | Purchase Money Mortgage | |
| Previous Owner | $171,200 | Purchase Money Mortgage | |
| Previous Owner | $173,600 | Purchase Money Mortgage | |
| Previous Owner | $161,060 | Purchase Money Mortgage | |
| Previous Owner | $87,679 | Purchase Money Mortgage |
| Date | Event | Price | List to Sale | Price per Sq Ft |
|---|---|---|---|---|
| 10/31/2025 10/31/25 | Sold | $480,000 | 0.0% | $208 / Sq Ft |
| 09/03/2025 09/03/25 | Pending | -- | -- | -- |
| 08/26/2025 08/26/25 | For Sale | $480,000 | -- | $208 / Sq Ft |
| Year | Tax Paid | Tax Assessment Tax Assessment Total Assessment is a certain percentage of the fair market value that is determined by local assessors to be the total taxable value of land and additions on the property. | Land | Improvement |
|---|---|---|---|---|
| 2024 | $4,981 | $307,300 | $88,400 | $218,900 |
| 2023 | $4,978 | $307,300 | $88,400 | $218,900 |
| 2022 | $4,905 | $307,300 | $88,400 | $218,900 |
| 2021 | $4,494 | $189,200 | $48,800 | $140,400 |
| 2020 | $4,654 | $189,200 | $48,800 | $140,400 |
| 2019 | $4,378 | $189,200 | $48,800 | $140,400 |
| 2018 | $4,401 | $189,200 | $48,800 | $140,400 |
| 2017 | $4,541 | $189,200 | $48,800 | $140,400 |
| 2016 | $3,979 | $162,000 | $42,700 | $119,300 |
| 2015 | $3,925 | $162,000 | $42,700 | $119,300 |
| 2014 | $3,761 | $161,400 | $42,700 | $118,700 |
| 2012 | $3,898 | $161,400 | $42,700 | $118,700 |
Seller's Agent in 2025
Joshua Winn
Realty One Group Next Level
(603) 391-5503
1 in this area
139 Total Sales
Buyer's Agent in 2025
Susan Love
Duston Leddy Real Estate
(908) 656-2028
1 in this area
83 Total Sales
Source: PrimeMLS
MLS Number: 5058324
APN: SLSB-000238-000000-000015
Disclaimer: Certain information contained herein is derived from information provided by parties other than Homes.com. All information provided is deemed reliable, but is not guaranteed to be accurate and should be independently verified.
![]() Copyright 2025 PrimeMLS, Inc. All rights reserved. This information is deemed reliable, but not guaranteed. The data relating to real estate displayed on this display comes in part from the IDX Program of PrimeMLS. The information being provided is for consumers’ personal, non-commercial use and may not be used for any purpose other than to identify prospective properties consumers may be interested in purchasing.
Copyright 2025 PrimeMLS, Inc. All rights reserved. This information is deemed reliable, but not guaranteed. The data relating to real estate displayed on this display comes in part from the IDX Program of PrimeMLS. The information being provided is for consumers’ personal, non-commercial use and may not be used for any purpose other than to identify prospective properties consumers may be interested in purchasing.