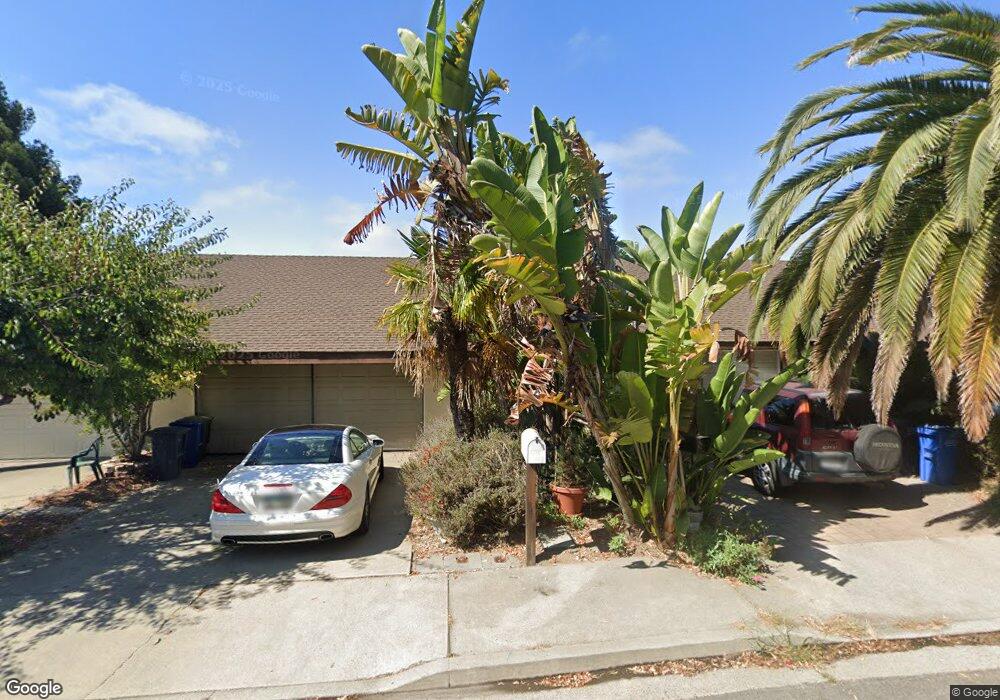
119 Le Point Terrace Arroyo Grande, CA 93420
Estimated Value: $543,000 - $603,000
2
Beds
2
Baths
1,257
Sq Ft
$445/Sq Ft
Est. Value
About This Home
This home is located at 119 Le Point Terrace, Arroyo Grande, CA 93420 and is currently estimated at $559,143, approximately $444 per square foot. 119 Le Point Terrace is a home located in San Luis Obispo County with nearby schools including Ocean View Elementary School, Paulding Middle School, and Arroyo Grande High School.
Ownership History
Date
Name
Owned For
Owner Type
Purchase Details
Closed on
Mar 13, 2024
Sold by
Timothy W Wilson 2023 Living Trust and Wilson Timothy W
Bought by
Ocamb Adam Michael and Ocamb Bethany Virginia
Current Estimated Value
Home Financials for this Owner
Home Financials are based on the most recent Mortgage that was taken out on this home.
Original Mortgage
$477,450
Outstanding Balance
$469,903
Interest Rate
6.9%
Mortgage Type
New Conventional
Estimated Equity
$89,240
Purchase Details
Closed on
Jul 27, 2023
Sold by
Timothy W Wilson Inter Vivos Trust
Bought by
Timothy W Wilson 2023 Living Trust and Wilson
Purchase Details
Closed on
Mar 26, 2014
Sold by
Wilson Timothy Wallace
Bought by
Wilson Timothy W
Purchase Details
Closed on
Oct 20, 1999
Sold by
Ortiz Wilson Timothy Wallace and Ortiz Wilson Gloria
Bought by
Wilson Timothy Wallace
Create a Home Valuation Report for This Property
The Home Valuation Report is an in-depth analysis detailing your home's value as well as a comparison with similar homes in the area
Home Values in the Area
Average Home Value in this Area
Purchase History
| Date | Buyer | Sale Price | Title Company |
|---|---|---|---|
| Ocamb Adam Michael | $530,500 | Placer Title | |
| Timothy W Wilson 2023 Living Trust | -- | None Listed On Document | |
| Wilson Timothy W | -- | None Available | |
| Wilson Timothy Wallace | -- | -- |
Source: Public Records
Mortgage History
| Date | Status | Borrower | Loan Amount |
|---|---|---|---|
| Open | Ocamb Adam Michael | $477,450 |
Source: Public Records
Tax History Compared to Growth
Tax History
| Year | Tax Paid | Tax Assessment Tax Assessment Total Assessment is a certain percentage of the fair market value that is determined by local assessors to be the total taxable value of land and additions on the property. | Land | Improvement |
|---|---|---|---|---|
| 2025 | $1,629 | $541,110 | $306,000 | $235,110 |
| 2024 | $1,608 | $161,340 | $43,137 | $118,203 |
| 2023 | $1,608 | $158,178 | $42,292 | $115,886 |
| 2022 | $1,583 | $155,077 | $41,463 | $113,614 |
| 2021 | $1,578 | $152,037 | $40,650 | $111,387 |
| 2020 | $1,559 | $150,479 | $40,234 | $110,245 |
| 2019 | $1,547 | $147,530 | $39,446 | $108,084 |
| 2018 | $1,527 | $144,638 | $38,673 | $105,965 |
| 2017 | $1,500 | $141,803 | $37,915 | $103,888 |
| 2016 | $1,415 | $139,023 | $37,172 | $101,851 |
| 2015 | $1,402 | $136,936 | $36,614 | $100,322 |
| 2014 | $1,350 | $134,254 | $35,897 | $98,357 |
Source: Public Records
Map
Nearby Homes
- 555 Le Point St
- 547 May St
- 212 Miller Way
- 251 James Way
- 324 Short St
- 318 Myrtle Dr
- 807 Plata Rd
- 950 Huasna Rd Unit 41
- 950 Huasna Rd Unit 20
- 535 Los Olivos Ln
- 289 Mercedes Ln
- 261 Haven Ct
- 604 Hillside Ct
- 411 Spanish Moss Ln
- 432 California St
- 434 Spanish Moss Ln
- 1130 Vard Loomis Ln
- 210 Acero Place
- 413 Via Bandolero
- 553 Rosemary Ln
- 127 Le Point Terrace
- 111 Le Point Terrace
- 135 Le Point St
- 135 Le Point Terrace
- 143 Le Point Terrace
- 143 Le Point Terrace
- 103 Le Point Terrace
- 151 Le Point Terrace
- 151 Le Point Terrace
- 100 Crown Terrace
- 159 Le Point Terrace
- 513 Crown Hill St
- 513 Crown Hill St Unit B
- 513 Crown Hill St Unit 5
- 509 Crown Hill St
- 523 Crown Hill St Unit B
- 523 Crown Hill St Unit A
- 519 Crown Hill St Unit B
- 509 Crown Hill St Unit B