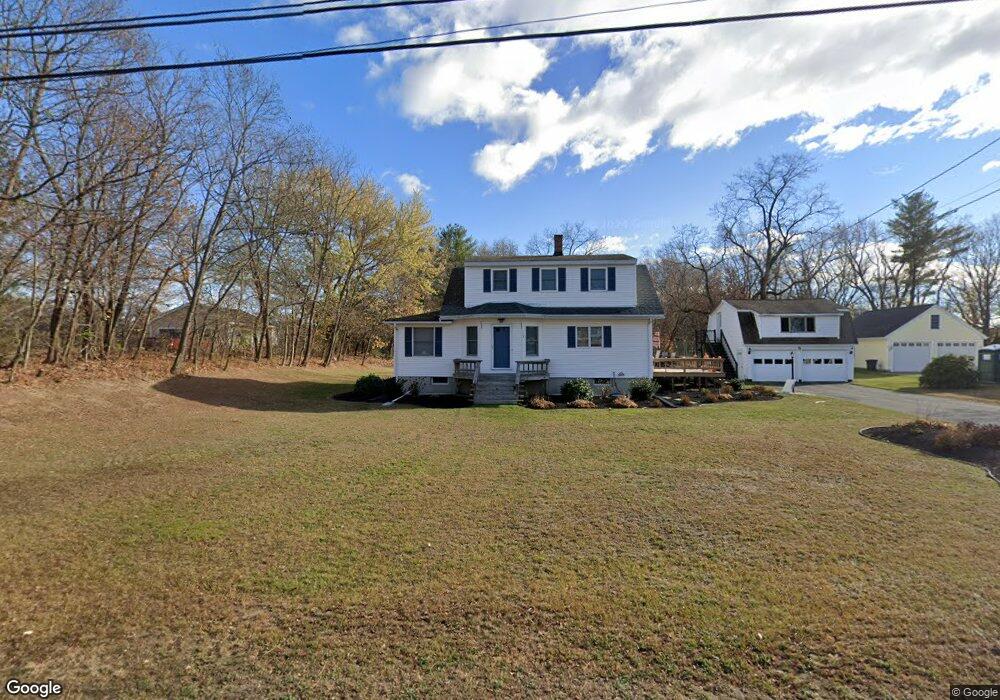
119 Main St Salisbury, MA 01952
Estimated Value: $558,637 - $700,000
2
Beds
2
Baths
1,645
Sq Ft
$395/Sq Ft
Est. Value
About This Home
This home is located at 119 Main St, Salisbury, MA 01952 and is currently estimated at $650,159, approximately $395 per square foot. 119 Main St is a home located in Essex County with nearby schools including Triton Regional High School and Amesbury Seventh-Day Adventist School.
Ownership History
Date
Name
Owned For
Owner Type
Purchase Details
Closed on
Apr 2, 2022
Sold by
Fizgerald David J and Marshall Kerry
Bought by
Marshall Bryan and Marshall Kerry
Current Estimated Value
Home Financials for this Owner
Home Financials are based on the most recent Mortgage that was taken out on this home.
Original Mortgage
$314,000
Outstanding Balance
$292,305
Interest Rate
3.76%
Mortgage Type
New Conventional
Estimated Equity
$357,854
Purchase Details
Closed on
Sep 30, 2009
Sold by
Johnson Patricia C
Bought by
Marshall Bryan and Gavin Kerry
Home Financials for this Owner
Home Financials are based on the most recent Mortgage that was taken out on this home.
Original Mortgage
$275,000
Interest Rate
5.12%
Mortgage Type
Purchase Money Mortgage
Purchase Details
Closed on
Mar 30, 2001
Sold by
Clopton Edward B and Clopton Marcia G
Bought by
Clopton Marc A
Purchase Details
Closed on
Dec 30, 1999
Sold by
Swanson Peter C
Bought by
Clopton Edward B and Clopton Marcia G
Create a Home Valuation Report for This Property
The Home Valuation Report is an in-depth analysis detailing your home's value as well as a comparison with similar homes in the area
Home Values in the Area
Average Home Value in this Area
Purchase History
| Date | Buyer | Sale Price | Title Company |
|---|---|---|---|
| Marshall Bryan | -- | None Available | |
| Marshall Bryan | -- | None Available | |
| Marshall Bryan | -- | None Available | |
| Marshall Bryan | $289,500 | -- | |
| Clopton Marc A | $135,000 | -- | |
| Clopton Edward B | $105,000 | -- | |
| Marshall Bryan | $289,500 | -- | |
| Clopton Marc A | $135,000 | -- | |
| Clopton Edward B | $105,000 | -- |
Source: Public Records
Mortgage History
| Date | Status | Borrower | Loan Amount |
|---|---|---|---|
| Open | Marshall Bryan | $314,000 | |
| Closed | Marshall Bryan | $314,000 | |
| Previous Owner | Clopton Edward B | $275,000 |
Source: Public Records
Tax History
| Year | Tax Paid | Tax Assessment Tax Assessment Total Assessment is a certain percentage of the fair market value that is determined by local assessors to be the total taxable value of land and additions on the property. | Land | Improvement |
|---|---|---|---|---|
| 2025 | $4,441 | $440,600 | $160,200 | $280,400 |
| 2024 | $4,543 | $434,700 | $160,200 | $274,500 |
| 2023 | $4,439 | $411,000 | $160,200 | $250,800 |
| 2022 | $4,328 | $388,500 | $145,600 | $242,900 |
| 2021 | $4,175 | $370,800 | $145,600 | $225,200 |
| 2020 | $3,995 | $348,600 | $147,900 | $200,700 |
| 2019 | $4,028 | $339,600 | $147,900 | $191,700 |
| 2018 | $3,912 | $332,100 | $147,900 | $184,200 |
| 2017 | $3,571 | $299,600 | $126,800 | $172,800 |
| 2016 | $3,366 | $288,400 | $120,400 | $168,000 |
| 2015 | $3,312 | $281,900 | $120,400 | $161,500 |
Source: Public Records
Map
Nearby Homes
- 82 Monroe St
- 53 Rabbit Rd
- 9 Elmwood St
- 7 Toll Rd
- 57 Baker Rd
- 25 Bayberry Ln
- 21 Congress St
- 188 Lafayette Rd
- 97 Elm St
- 154 Lafayette Rd
- 25 Cedar St Unit 4
- 5 Russell St Unit 1
- 191 Elm St
- 3 Birchwood Point Unit 202
- 149 Market St
- 105 Market St Unit B
- 101 Market St Unit B
- 4 Clark St
- 7 Birchwood Pointe Unit 101
- 241 & 245 Lafayette Rd
Your Personal Tour Guide
Ask me questions while you tour the home.