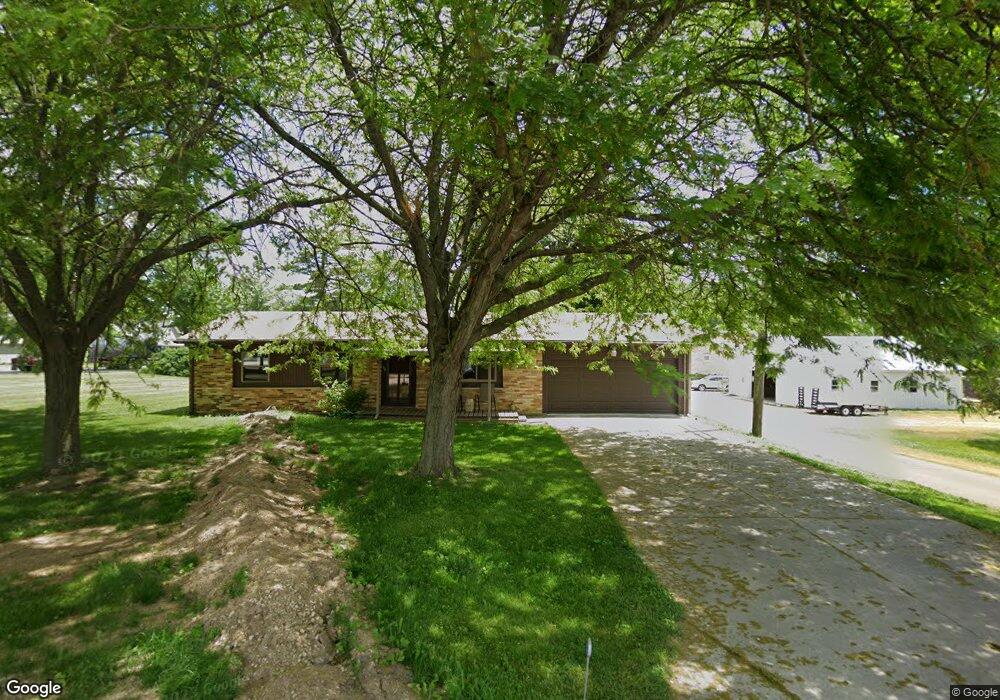
119 S Main St Warren, IN 46792
Estimated Value: $121,000 - $140,671
3
Beds
1
Bath
1,364
Sq Ft
$96/Sq Ft
Est. Value
About This Home
This home is located at 119 S Main St, Warren, IN 46792 and is currently estimated at $130,668, approximately $95 per square foot. 119 S Main St is a home located in Huntington County with nearby schools including Salamonie School and Huntington North High School.
Ownership History
Date
Name
Owned For
Owner Type
Purchase Details
Closed on
Oct 9, 2023
Sold by
Myers Shad A
Bought by
Snyder Christopher Levi
Current Estimated Value
Home Financials for this Owner
Home Financials are based on the most recent Mortgage that was taken out on this home.
Original Mortgage
$124,500
Interest Rate
7.18%
Mortgage Type
New Conventional
Purchase Details
Closed on
Oct 5, 2023
Sold by
Haggerty Michael
Bought by
Myers Shad A
Home Financials for this Owner
Home Financials are based on the most recent Mortgage that was taken out on this home.
Original Mortgage
$124,500
Interest Rate
7.18%
Mortgage Type
New Conventional
Purchase Details
Closed on
Feb 9, 2010
Sold by
Us Bank Na
Bought by
Myers Shad A and Haggerty Michael
Purchase Details
Closed on
Nov 19, 2009
Sold by
Farthing Kent
Bought by
U S Bank As Suc Tr As S
Purchase Details
Closed on
Feb 6, 2007
Sold by
Arbuckle Brad A and Arbuckle Denise A
Bought by
Arbuckle Denie A
Create a Home Valuation Report for This Property
The Home Valuation Report is an in-depth analysis detailing your home's value as well as a comparison with similar homes in the area
Home Values in the Area
Average Home Value in this Area
Purchase History
| Date | Buyer | Sale Price | Title Company |
|---|---|---|---|
| Snyder Christopher Levi | $110,000 | None Listed On Document | |
| Myers Shad A | $110,000 | None Listed On Document | |
| Myers Shad A | -- | None Available | |
| U S Bank As Suc Tr As S | $40,300 | Doyle Legal Corporation Pc | |
| U S Bank Na | $40,300 | None Available | |
| Arbuckle Denie A | -- | None Available |
Source: Public Records
Mortgage History
| Date | Status | Borrower | Loan Amount |
|---|---|---|---|
| Closed | Snyder Christopher Levi | $124,500 |
Source: Public Records
Tax History Compared to Growth
Tax History
| Year | Tax Paid | Tax Assessment Tax Assessment Total Assessment is a certain percentage of the fair market value that is determined by local assessors to be the total taxable value of land and additions on the property. | Land | Improvement |
|---|---|---|---|---|
| 2024 | $1,337 | $134,400 | $10,500 | $123,900 |
| 2023 | $1,192 | $122,900 | $10,500 | $112,400 |
| 2022 | $1,043 | $111,500 | $10,500 | $101,000 |
| 2021 | $970 | $103,100 | $10,500 | $92,600 |
| 2020 | $967 | $101,800 | $10,500 | $91,300 |
| 2019 | $716 | $90,300 | $10,500 | $79,800 |
| 2018 | $748 | $85,900 | $10,500 | $75,400 |
| 2017 | $693 | $85,600 | $10,500 | $75,100 |
| 2016 | $583 | $84,900 | $10,500 | $74,400 |
| 2014 | $530 | $81,500 | $10,500 | $71,000 |
| 2013 | $530 | $78,900 | $10,500 | $68,400 |
Source: Public Records
Map
Nearby Homes