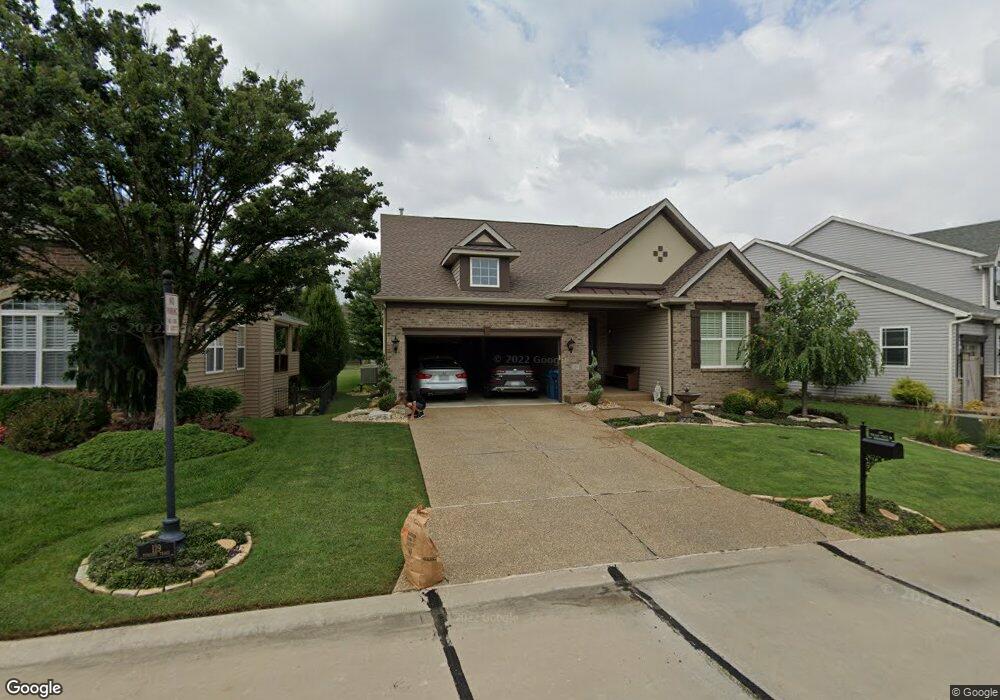
119 Tuscany Trace - Uc Saint Charles, MO 63303
Estimated Value: $449,155 - $483,000
3
Beds
2
Baths
1,882
Sq Ft
$251/Sq Ft
Est. Value
About This Home
This home is located at 119 Tuscany Trace - Uc, Saint Charles, MO 63303 and is currently estimated at $471,539, approximately $250 per square foot. 119 Tuscany Trace - Uc is a home located in St. Charles County with nearby schools including Harvest Ridge Elementary School, Barnwell Middle School, and Francis Howell North High School.
Ownership History
Date
Name
Owned For
Owner Type
Purchase Details
Closed on
Aug 18, 2025
Sold by
Timpone Joseph P and Timpone Mary E
Bought by
Smith Douglas H and Smith Melodie R
Current Estimated Value
Purchase Details
Closed on
Aug 7, 2017
Sold by
Nickeson Sally T and Nickeson Brian L
Bought by
Timpone Joseph P and Timpone Mary E
Home Financials for this Owner
Home Financials are based on the most recent Mortgage that was taken out on this home.
Original Mortgage
$261,600
Interest Rate
3.88%
Mortgage Type
New Conventional
Purchase Details
Closed on
Dec 14, 2012
Sold by
Payne Family Homes At Tuscany Llc
Bought by
Nickeson Brian L and Nickeson Sally T
Home Financials for this Owner
Home Financials are based on the most recent Mortgage that was taken out on this home.
Original Mortgage
$286,171
Interest Rate
2.87%
Mortgage Type
FHA
Create a Home Valuation Report for This Property
The Home Valuation Report is an in-depth analysis detailing your home's value as well as a comparison with similar homes in the area
Home Values in the Area
Average Home Value in this Area
Purchase History
| Date | Buyer | Sale Price | Title Company |
|---|---|---|---|
| Smith Douglas H | -- | Title Experts | |
| Timpone Joseph P | $327,000 | None Available | |
| Nickeson Brian L | $295,645 | None Available |
Source: Public Records
Mortgage History
| Date | Status | Borrower | Loan Amount |
|---|---|---|---|
| Previous Owner | Timpone Joseph P | $261,600 | |
| Previous Owner | Nickeson Brian L | $286,171 |
Source: Public Records
Tax History Compared to Growth
Tax History
| Year | Tax Paid | Tax Assessment Tax Assessment Total Assessment is a certain percentage of the fair market value that is determined by local assessors to be the total taxable value of land and additions on the property. | Land | Improvement |
|---|---|---|---|---|
| 2025 | $4,655 | $89,962 | -- | -- |
| 2024 | $4,655 | $78,648 | -- | -- |
| 2023 | $4,653 | $78,648 | $0 | $0 |
| 2022 | $3,936 | $61,856 | $0 | $0 |
| 2021 | $3,940 | $61,856 | $0 | $0 |
| 2020 | $4,153 | $62,734 | $0 | $0 |
| 2019 | $4,134 | $62,734 | $0 | $0 |
| 2018 | $3,996 | $57,470 | $0 | $0 |
| 2017 | $3,938 | $57,470 | $0 | $0 |
| 2016 | $3,862 | $54,305 | $0 | $0 |
| 2015 | $3,854 | $54,305 | $0 | $0 |
| 2014 | $4,106 | $56,173 | $0 | $0 |
Source: Public Records
Map
Nearby Homes
- 106 Tuscany Trace Dr
- 0 Hemsath Rd Unit 22063361
- 0 Hemsath Rd Unit 22058650
- 529 Blanche Dr
- 4 Sassafras Ct
- 2816 Mulberry Ln
- 2820 Mulberry Ln
- 2824 Mulberry Ln
- 2828 Mulberry Ln
- 365 Clarence Dr
- 248 Blanche Dr
- 34 Bonhomme Richard Ct
- 2074 Duclair Pkwy
- 217 Pralle Ln
- 2338 Eagle Pines Dr
- 440 Fort Saratoga
- 418 Savannah Ridge Dr
- 2 Aspen Ct
- 390 Portsmouth Dr
- 1380 Heritage Landing Unit 206
- 113 Tuscany Trace Dr
- 129 Tuscany Trace Dr
- 405 Tuscany Trace Ct
- 139 Tuscany Trace Dr
- 118 Tuscany Trace Dr
- 409 Tuscany Trace Ct
- 114 Tuscany Trace Dr
- 105 Tuscany Trace Dr
- 126 Tuscany Trace Dr
- 1 Tuscany Trace Dr
- 0Lot 41 Tuscany Trace Ct
- 110 Tuscany Trace Dr
- 21 Tuscany Trace Dr
- 130 Tuscany Trace Dr
- 130 Tuscany Trace - Uc
- 29 Tuscany Trace Dr
- 404 Tuscany Trace Ct
- 97 Tuscany Trace Dr
- 134 Tuscany Trace Dr
- 138Lot #33 Tuscany Trace Dr