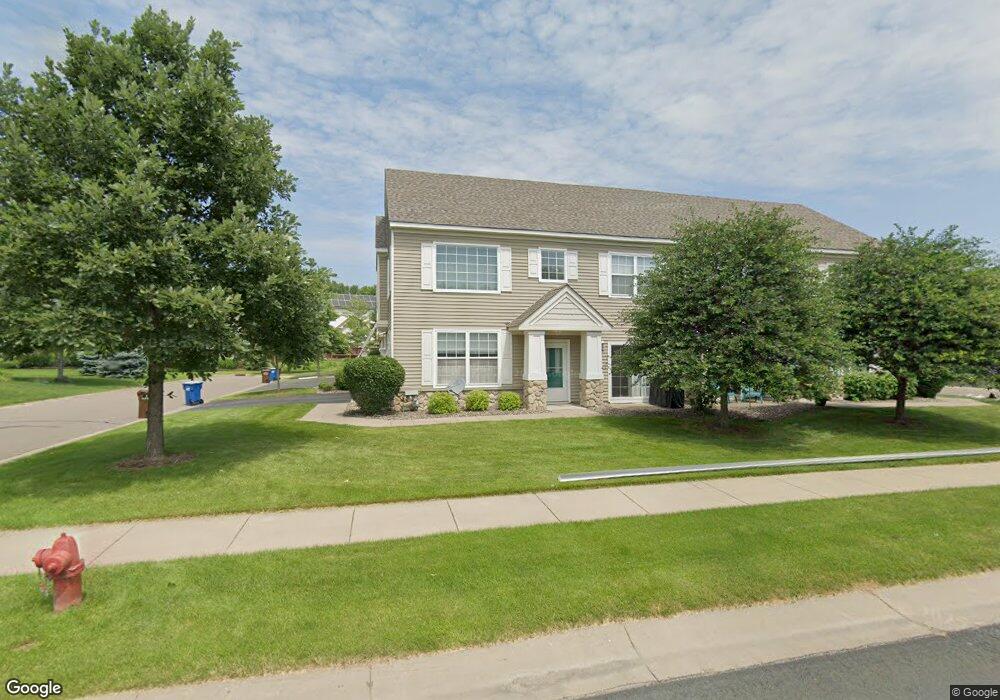
11908 85th Place N Maple Grove, MN 55369
Estimated Value: $290,000 - $321,000
2
Beds
3
Baths
1,632
Sq Ft
$187/Sq Ft
Est. Value
About This Home
This home is located at 11908 85th Place N, Maple Grove, MN 55369 and is currently estimated at $304,823, approximately $186 per square foot. 11908 85th Place N is a home located in Hennepin County with nearby schools including Rice Lake Elementary School, Maple Grove Middle School, and Maple Grove Senior High School.
Ownership History
Date
Name
Owned For
Owner Type
Purchase Details
Closed on
Nov 21, 2019
Sold by
Storck Schattner Denise and Schattner Steven
Bought by
Turea Petru and Ivasenco Anna
Current Estimated Value
Home Financials for this Owner
Home Financials are based on the most recent Mortgage that was taken out on this home.
Original Mortgage
$226,010
Outstanding Balance
$201,390
Interest Rate
3.6%
Estimated Equity
$90,232
Purchase Details
Closed on
Oct 2, 2017
Sold by
Giles Matthew R and Giles Jamie
Bought by
Schattner Denies Storck and Schattner Steven
Home Financials for this Owner
Home Financials are based on the most recent Mortgage that was taken out on this home.
Original Mortgage
$169,600
Interest Rate
3.83%
Mortgage Type
New Conventional
Purchase Details
Closed on
Feb 28, 2005
Sold by
Carrillo Stephen A
Bought by
Giles Matthew R
Purchase Details
Closed on
Mar 29, 2001
Sold by
The Rottlund Company Inc
Bought by
Carrillo Stephen A
Create a Home Valuation Report for This Property
The Home Valuation Report is an in-depth analysis detailing your home's value as well as a comparison with similar homes in the area
Home Values in the Area
Average Home Value in this Area
Purchase History
| Date | Buyer | Sale Price | Title Company |
|---|---|---|---|
| Turea Petru | $235,000 | Titlesmart Inc | |
| Schattner Denies Storck | $212,000 | Executive Title | |
| Giles Matthew R | $200,000 | -- | |
| Carrillo Stephen A | $150,970 | -- | |
| The Rottlund Company Inc | $10,500 | -- |
Source: Public Records
Mortgage History
| Date | Status | Borrower | Loan Amount |
|---|---|---|---|
| Open | Turea Petru | $226,010 | |
| Previous Owner | Schattner Denies Storck | $169,600 | |
| Previous Owner | Gills Matthew R | $55,000 |
Source: Public Records
Tax History Compared to Growth
Tax History
| Year | Tax Paid | Tax Assessment Tax Assessment Total Assessment is a certain percentage of the fair market value that is determined by local assessors to be the total taxable value of land and additions on the property. | Land | Improvement |
|---|---|---|---|---|
| 2023 | $3,176 | $279,900 | $67,800 | $212,100 |
| 2022 | $2,716 | $267,700 | $44,100 | $223,600 |
| 2021 | $2,579 | $236,500 | $40,400 | $196,100 |
| 2020 | $2,525 | $221,700 | $32,500 | $189,200 |
| 2019 | $2,432 | $209,100 | $33,400 | $175,700 |
| 2018 | $2,352 | $192,500 | $30,000 | $162,500 |
| 2017 | $2,186 | $167,400 | $34,500 | $132,900 |
| 2016 | $2,074 | $158,300 | $31,000 | $127,300 |
| 2015 | $1,945 | $146,600 | $28,000 | $118,600 |
| 2014 | -- | $133,200 | $28,000 | $105,200 |
Source: Public Records
Map
Nearby Homes
- 11861 85th Place N
- 8479 Forestview Ln N Unit 26
- 11955 84th Place N
- 12153 87th Ave N
- 11712 84th Ave N Unit 309
- 8821 Jonquil Ln N
- 11617 88th Place N
- 11760 88th Place N
- 8712 Cottonwood Ln N
- 8312 Jonquil Ln N
- 8344 Cottonwood Ln N
- 8905 Magnolia Ln N
- 8389 Norwood Ln N
- 8917 Norwood Ln N
- 8397 Norwood Ln N
- 12590 88th Place N
- 8993 Magnolia Ln N
- 11486 81st Place N
- 8279 Norwood Ln N
- 12769 88th Ave N
- 11912 85th Place N
- 11904 85th Place N Unit 6
- 11900 85th Place N Unit 5
- 11916 85th Place N Unit 4
- 11924 85th Place N
- 11920 85th Place N
- 11900 11900 85th-Place-n
- 11920 11920 85th-Place-n
- 11916 11916 85th Place N
- 11912 11912 85th Place N
- 11920 11920 85th Place N
- 11928 85th Place N
- 11962 85th Place N
- 11872 85th Place N
- 11868 85th Place N
- 11864 85th Place N
- 11884 85th Place N
- 11880 11880 85th-Place-n
- 11880 11880 85th Place N
- 11884 11884 85th Place N