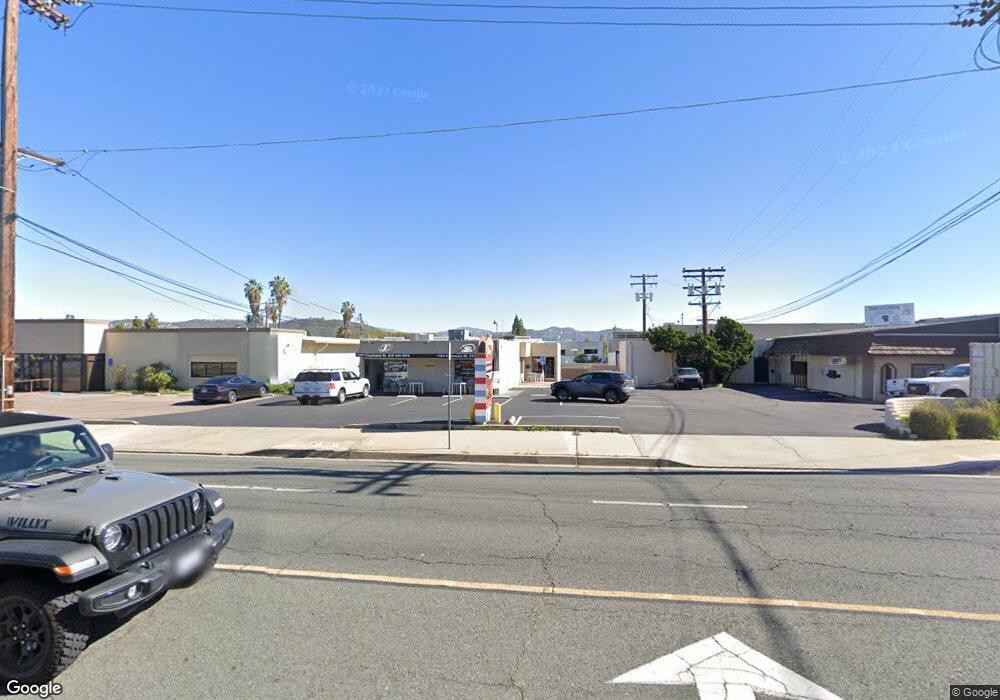
1191 1191 N CuyaMacA St El Cajon, CA 92020
Estimated Value: $611,700
--
Bed
--
Bath
2,520
Sq Ft
$243/Sq Ft
Est. Value
About This Home
This home is located at 1191 1191 N CuyaMacA St, El Cajon, CA 92020 and is currently estimated at $611,700, approximately $242 per square foot. 1191 1191 N CuyaMacA St is a home located in San Diego County with nearby schools including Flying Hills Elementary School, Grossmont High School, and St Ephrem Maronite Catholic Academy.
Ownership History
Date
Name
Owned For
Owner Type
Purchase Details
Closed on
May 26, 2020
Sold by
Cholagh Eman Elias
Bought by
Cholagh Arjank T and Cholagh Eman Elias
Current Estimated Value
Purchase Details
Closed on
Nov 8, 2016
Sold by
Cholagh Arjank Thomas
Bought by
Cholagh Eman Elias
Home Financials for this Owner
Home Financials are based on the most recent Mortgage that was taken out on this home.
Original Mortgage
$205,000
Outstanding Balance
$164,579
Interest Rate
3.42%
Mortgage Type
Commercial
Estimated Equity
$447,121
Purchase Details
Closed on
Nov 7, 2016
Sold by
Ciccati Louis and Ciccati Adeline Carmela
Bought by
Cholagh Eman Elias
Home Financials for this Owner
Home Financials are based on the most recent Mortgage that was taken out on this home.
Original Mortgage
$205,000
Outstanding Balance
$164,579
Interest Rate
3.42%
Mortgage Type
Commercial
Estimated Equity
$447,121
Purchase Details
Closed on
Dec 17, 2004
Sold by
Ciccati Louis and Ciccati Adeline Carmela
Bought by
Ciccati Louis and Ciccati Adeline Carmela
Create a Home Valuation Report for This Property
The Home Valuation Report is an in-depth analysis detailing your home's value as well as a comparison with similar homes in the area
Home Values in the Area
Average Home Value in this Area
Purchase History
| Date | Buyer | Sale Price | Title Company |
|---|---|---|---|
| Cholagh Arjank T | -- | None Available | |
| Cholagh Eman Elias | -- | Ticor Title San Diego | |
| Cholagh Eman Elias | $350,000 | Ticor Title San Diego | |
| Ciccati Louis | -- | -- | |
| Ciccati Louis | -- | -- |
Source: Public Records
Mortgage History
| Date | Status | Borrower | Loan Amount |
|---|---|---|---|
| Open | Cholagh Eman Elias | $205,000 |
Source: Public Records
Tax History Compared to Growth
Tax History
| Year | Tax Paid | Tax Assessment Tax Assessment Total Assessment is a certain percentage of the fair market value that is determined by local assessors to be the total taxable value of land and additions on the property. | Land | Improvement |
|---|---|---|---|---|
| 2025 | $6,585 | $452,623 | $261,128 | $191,495 |
| 2024 | $6,585 | $443,749 | $256,008 | $187,741 |
| 2023 | $6,848 | $435,049 | $250,989 | $184,060 |
| 2022 | $6,218 | $426,519 | $246,068 | $180,451 |
| 2021 | $5,928 | $418,157 | $241,244 | $176,913 |
| 2020 | $5,899 | $413,870 | $238,771 | $175,099 |
| 2019 | $4,956 | $405,756 | $234,090 | $171,666 |
| 2018 | $4,876 | $397,800 | $229,500 | $168,300 |
| 2017 | $4,814 | $390,000 | $225,000 | $165,000 |
| 2016 | $1,220 | $99,289 | $37,250 | $62,039 |
| 2015 | $1,214 | $97,799 | $36,691 | $61,108 |
| 2014 | $1,191 | $95,884 | $35,973 | $59,911 |
Source: Public Records
Map
Nearby Homes
- 1340 Heron Ave
- 1677 Heron Ave
- 741 N Pierce St
- 731 Dewane Dr
- 701 El Monte Rd
- 1387 Weers St
- 0 Hacienda Dr
- 2052 Flying Hills Ln
- 1958 Milford Place
- 2106 Windmill View Rd
- 589 N Johnson Ave Unit 247
- 589 N Johnson Ave Unit 130
- 370 N Cuyamaca St
- 346 El Monte Rd
- 1673 Hillsmont Dr
- 1681 Hillsmont Dr
- 1498 Berenda Place
- 484 Gardner St
- 436 Gardner St
- 1280 W Main St Unit 24
- 1193-1195 1193-1195 CuyaMacA St
- 1191 N Cuyamaca St
- 1191-1197 1191-1197 N CuyaMacA St
- 1193 N Cuyamaca St
- 1179 Cuyamaca St Unit F
- 1179 Cuyamaca St
- 1300 Heron Ave
- 1246 1246 Vernon Way
- 1204 N Cuyamaca St
- 1246 Vernon Way
- 1226 N Cuyamaca St
- 1226 N Cuyamaca St
- 1320 Heron Ave
- 1248 N Cuyamaca St
- 1262 N Cuyamaca St
- 1274 N Cuyamaca St
- 1188 N Cuyamaca St
- 1240 Vernon Way
- 1240 Vernon Way
- 1286 N Cuyamaca St