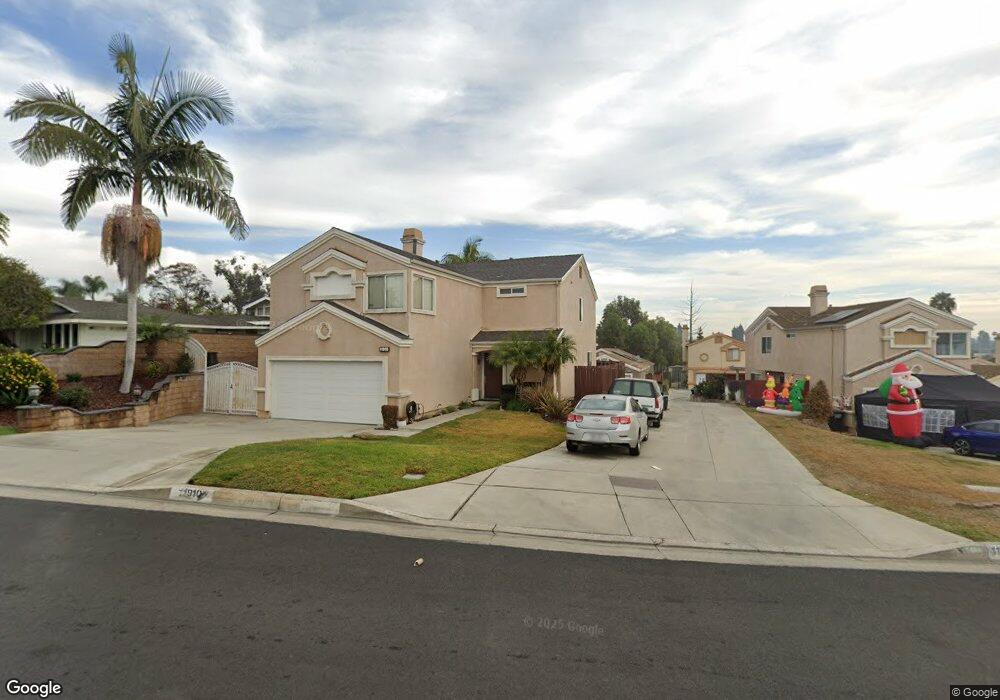
11910 Ramsey Dr Whittier, CA 90605
South Whittier NeighborhoodEstimated Value: $790,000 - $883,000
4
Beds
3
Baths
2,042
Sq Ft
$418/Sq Ft
Est. Value
About This Home
This home is located at 11910 Ramsey Dr, Whittier, CA 90605 and is currently estimated at $853,223, approximately $417 per square foot. 11910 Ramsey Dr is a home located in Los Angeles County with nearby schools including California High School and St. Gregory The Great.
Ownership History
Date
Name
Owned For
Owner Type
Purchase Details
Closed on
Aug 9, 2022
Sold by
James Finley Richard and Mercado Leticia
Bought by
Finley Family Revocable Trust
Current Estimated Value
Purchase Details
Closed on
Sep 5, 2019
Sold by
Finley Ronald Ross and Finley Patsy Sue
Bought by
Finley Richard James and Finley Leticia Mercado
Home Financials for this Owner
Home Financials are based on the most recent Mortgage that was taken out on this home.
Original Mortgage
$126,000
Interest Rate
3.6%
Mortgage Type
New Conventional
Purchase Details
Closed on
Mar 2, 2001
Sold by
New Castle Development Inc
Bought by
Finley Richard James
Home Financials for this Owner
Home Financials are based on the most recent Mortgage that was taken out on this home.
Original Mortgage
$194,242
Interest Rate
6.98%
Purchase Details
Closed on
Jul 29, 1996
Sold by
800 Rose Partnership
Bought by
Firstline Services Inc
Purchase Details
Closed on
May 10, 1996
Sold by
Sharlein Carol
Bought by
800 Rose Partnership
Create a Home Valuation Report for This Property
The Home Valuation Report is an in-depth analysis detailing your home's value as well as a comparison with similar homes in the area
Home Values in the Area
Average Home Value in this Area
Purchase History
| Date | Buyer | Sale Price | Title Company |
|---|---|---|---|
| Finley Family Revocable Trust | -- | -- | |
| Finley Richard James | -- | -- | |
| Finley Richard James | -- | First American Title Ins Co | |
| Finley Richard James | $259,000 | Lawyers Title Company | |
| Firstline Services Inc | -- | First American Title Co | |
| 800 Rose Partnership | -- | -- |
Source: Public Records
Mortgage History
| Date | Status | Borrower | Loan Amount |
|---|---|---|---|
| Previous Owner | Finley Richard James | $126,000 | |
| Previous Owner | Finley Richard James | $194,242 |
Source: Public Records
Tax History
| Year | Tax Paid | Tax Assessment Tax Assessment Total Assessment is a certain percentage of the fair market value that is determined by local assessors to be the total taxable value of land and additions on the property. | Land | Improvement |
|---|---|---|---|---|
| 2025 | $6,953 | $573,478 | $351,724 | $221,754 |
| 2024 | $6,953 | $562,234 | $344,828 | $217,406 |
| 2023 | $6,733 | $551,211 | $338,067 | $213,144 |
| 2022 | $6,783 | $540,404 | $331,439 | $208,965 |
| 2021 | $6,638 | $529,809 | $324,941 | $204,868 |
| 2019 | $4,793 | $366,341 | $162,089 | $204,252 |
| 2018 | $4,621 | $359,159 | $158,911 | $200,248 |
| 2016 | $4,381 | $345,215 | $152,742 | $192,473 |
| 2015 | $4,271 | $340,030 | $150,448 | $189,582 |
| 2014 | $4,228 | $333,370 | $147,501 | $185,869 |
Source: Public Records
Map
Nearby Homes
- 13857 Leffingwell Rd
- 11827 Loma Dr Unit 15
- 13703 Placid Dr
- 13450 Meyer Rd Unit 33
- 13734 Busby Dr
- 11916 Carmenita Rd
- 11231 Inez St
- 14036 Lake View Dr Unit 143
- 0 Telegraph Rd Unit DW24244539
- 11235 Mina Ave
- 14000 Lake View Dr
- 14055 Lake View Dr
- 10912 Newgate Ave
- 11828 Louis Ave
- 14041 Lakeside Dr Unit 130
- 12707 Lake Forest Way Unit 135
- 10745 Victoria Ave Unit 4
- 10745 Victoria Ave Unit 6
- 12726 Lake Forest Ave Unit 25
- 14020 Lake Crest Dr Unit 84
- 11838 Ramsey Dr
- 11914 Ramsey Dr
- 11912 Ramsey Dr
- 13846 Utica St
- 11830 Ramsey Dr
- 11916 Ramsey Dr
- 13838 Utica St
- 11918 Ramsey Dr
- 11837 Ramsey Dr
- 13849 Brook Ct
- 13832 Utica St
- 11931 Ramsey Dr Unit 5
- 11822 Ramsey Dr
- 13829 Utica St
- 11920 Ramsey Dr
- 13843 Brook Ct
- 13826 Utica St
- 11823 Ramsey Dr
- 13807 Brook Ct
- 13806 Brook Ct
Your Personal Tour Guide
Ask me questions while you tour the home.