Estimated Value: $508,000 - $542,000
2
Beds
2
Baths
1,336
Sq Ft
$394/Sq Ft
Est. Value
About This Home
This home is located at 11919 Cayuga Place, Chino, CA 91710 and is currently estimated at $526,369, approximately $393 per square foot. 11919 Cayuga Place is a home located in San Bernardino County with nearby schools including E. J. Marshall Elementary, Magnolia Junior High, and Chino High School.
Ownership History
Date
Name
Owned For
Owner Type
Purchase Details
Closed on
Jun 14, 2010
Sold by
Brady Jessica L
Bought by
Miedema Carl Richard
Current Estimated Value
Home Financials for this Owner
Home Financials are based on the most recent Mortgage that was taken out on this home.
Original Mortgage
$186,558
Outstanding Balance
$124,663
Interest Rate
4.91%
Mortgage Type
FHA
Estimated Equity
$401,706
Purchase Details
Closed on
Feb 5, 2001
Sold by
Behm Joseph M
Bought by
Salazar Jessica Lee
Home Financials for this Owner
Home Financials are based on the most recent Mortgage that was taken out on this home.
Original Mortgage
$113,050
Interest Rate
7.11%
Purchase Details
Closed on
Jun 3, 1999
Sold by
Fox Laurie J
Bought by
Behm Joseph M and Behm Vilma
Home Financials for this Owner
Home Financials are based on the most recent Mortgage that was taken out on this home.
Original Mortgage
$95,404
Interest Rate
7.2%
Mortgage Type
FHA
Create a Home Valuation Report for This Property
The Home Valuation Report is an in-depth analysis detailing your home's value as well as a comparison with similar homes in the area
Home Values in the Area
Average Home Value in this Area
Purchase History
| Date | Buyer | Sale Price | Title Company |
|---|---|---|---|
| Miedema Carl Richard | $190,000 | Chicago Title Company | |
| Brady Jessica L | -- | Chicago Title Company | |
| Salazar Jessica Lee | $119,000 | Chicago Title Co | |
| Behm Joseph M | $97,000 | Ati Title | |
| Callahan Laurie Jean | -- | Ati Title |
Source: Public Records
Mortgage History
| Date | Status | Borrower | Loan Amount |
|---|---|---|---|
| Open | Miedema Carl Richard | $186,558 | |
| Previous Owner | Salazar Jessica Lee | $113,050 | |
| Previous Owner | Behm Joseph M | $95,404 |
Source: Public Records
Tax History Compared to Growth
Tax History
| Year | Tax Paid | Tax Assessment Tax Assessment Total Assessment is a certain percentage of the fair market value that is determined by local assessors to be the total taxable value of land and additions on the property. | Land | Improvement |
|---|---|---|---|---|
| 2025 | $2,678 | $245,256 | $85,839 | $159,417 |
| 2024 | $2,678 | $240,447 | $84,156 | $156,291 |
| 2023 | $2,604 | $235,732 | $82,506 | $153,226 |
| 2022 | $2,589 | $231,110 | $80,888 | $150,222 |
| 2021 | $2,538 | $226,578 | $79,302 | $147,276 |
| 2020 | $2,506 | $224,255 | $78,489 | $145,766 |
| 2019 | $2,462 | $219,858 | $76,950 | $142,908 |
| 2018 | $2,408 | $215,547 | $75,441 | $140,106 |
| 2017 | $2,365 | $211,321 | $73,962 | $137,359 |
| 2016 | $2,211 | $207,178 | $72,512 | $134,666 |
| 2015 | $2,167 | $204,066 | $71,423 | $132,643 |
| 2014 | $2,124 | $200,069 | $70,024 | $130,045 |
Source: Public Records
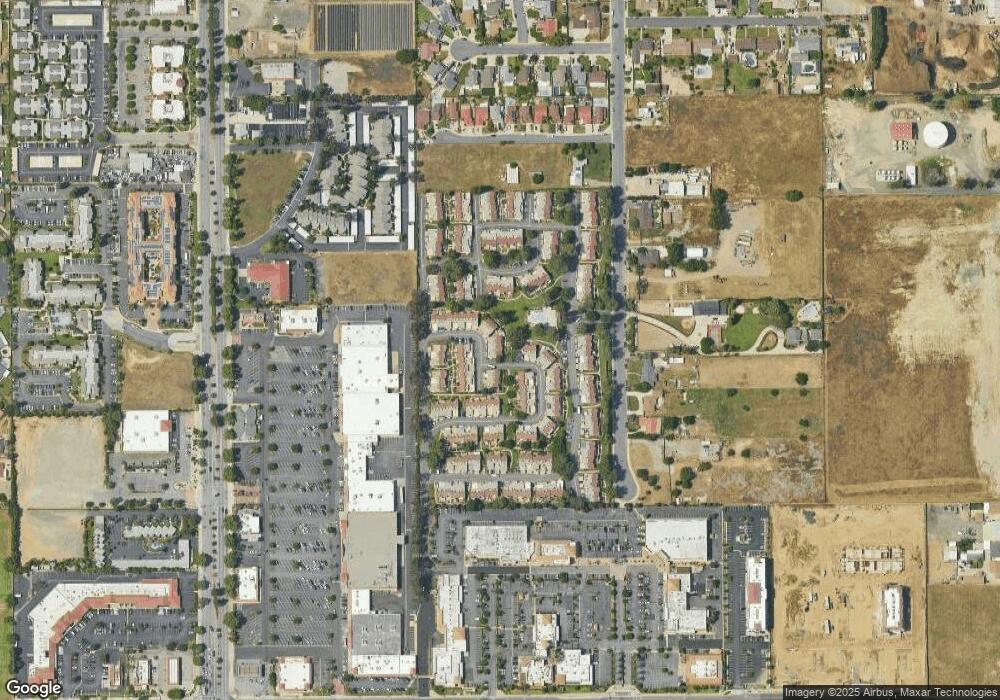
Map
Nearby Homes
- 11782 Vernon Ave
- 5500 Francis Ave
- 5373 Mariner Ln
- 1825 S Benson Ave
- 11628 Solaire Way
- 5061 Chesapeake St
- 5360 Malibu Way
- 5062 Taft St
- 5052 Taft St
- 5483 Dover St
- 1916 S Oaks Ave
- 5641 Buckthorn Ct
- 5610 Guardian Way
- 12351 Twin Gables Dr
- 12152 Crystal Ave
- 2064 S Magnolia Ave
- 12072 Carlisle Ave
- 12139 Serra Ave
- 1162 W Philadelphia St
- 6016 Harrison St
- 11911 Cayuga Place Unit 107
- 11911 Cayuga Place
- 11905 Cayuga Place Unit 108
- 11903 Cayuga Place Unit 109
- 11903 Cayuga Place
- 5468 Iowa Ct Unit 95
- 5468 Iowa Ct
- 11929 Cayuga Place Unit 98
- 5440 Iowa Ct
- 11910 Cayuga Place Unit 105
- 11910 Cayuga Place
- 11916 Cayuga Place Unit 104
- 11916 Cayuga Place
- 11922 Cayuga Place Unit 103
- 5472 Iowa Ct
- 11937 Cayuga Place
- 11928 Cayuga Place
- 5436 Iowa Ct
- 5476 Iowa Ct Unit 93
- 11934 Cayuga Place