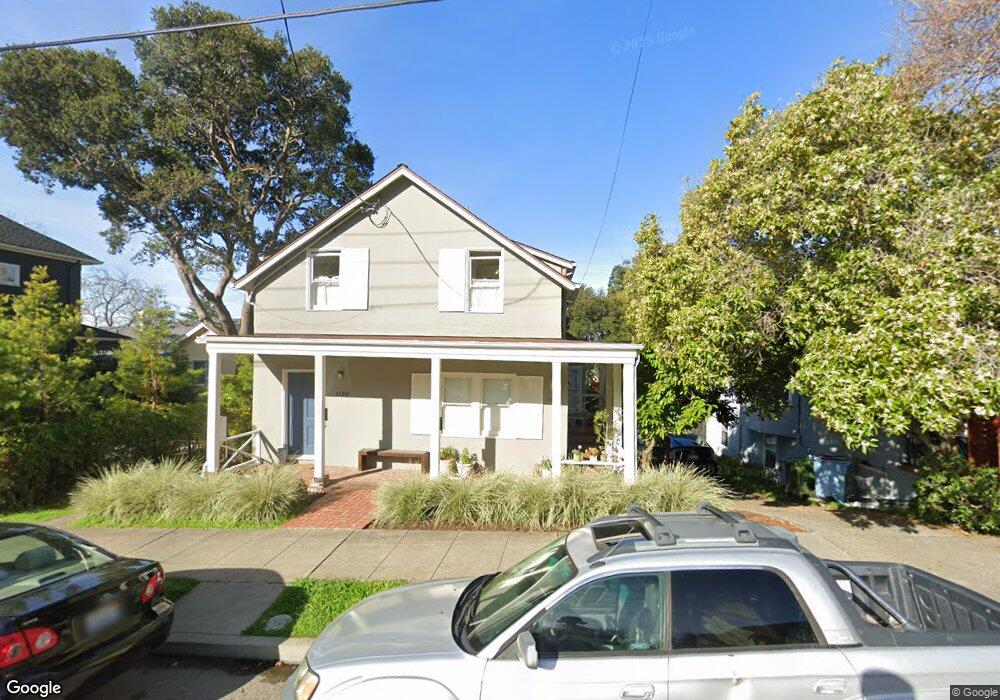
1192 Arch St Berkeley, CA 94708
Berkeley Hills NeighborhoodEstimated Value: $1,249,000 - $1,524,351
4
Beds
2
Baths
1,712
Sq Ft
$789/Sq Ft
Est. Value
About This Home
This home is located at 1192 Arch St, Berkeley, CA 94708 and is currently estimated at $1,350,088, approximately $788 per square foot. 1192 Arch St is a home located in Alameda County with nearby schools including Cragmont Elementary School, Berkeley Arts Magnet at Whittier School, and Washington Elementary School.
Ownership History
Date
Name
Owned For
Owner Type
Purchase Details
Closed on
Nov 22, 2017
Sold by
Cr Berkeley Residential Llc
Bought by
Lawrence Foley Ann and Lawrence Ruth
Current Estimated Value
Home Financials for this Owner
Home Financials are based on the most recent Mortgage that was taken out on this home.
Original Mortgage
$760,000
Outstanding Balance
$638,352
Interest Rate
3.94%
Mortgage Type
New Conventional
Estimated Equity
$711,736
Purchase Details
Closed on
Nov 21, 2016
Sold by
Berkeley 1 Llc
Bought by
Cr Berkeley Residential Llc
Purchase Details
Closed on
Nov 8, 2016
Sold by
Hammond Management Llc
Bought by
Berkeley 1 Llc and Berkeley 2 Llc
Purchase Details
Closed on
Dec 16, 1998
Sold by
Hammond Ara S
Bought by
Hammond Management Llc
Create a Home Valuation Report for This Property
The Home Valuation Report is an in-depth analysis detailing your home's value as well as a comparison with similar homes in the area
Home Values in the Area
Average Home Value in this Area
Purchase History
| Date | Buyer | Sale Price | Title Company |
|---|---|---|---|
| Lawrence Foley Ann | $950,000 | Old Republic Title Company | |
| Cr Berkeley Residential Llc | $1,200,000 | Chicago Title Company | |
| Berkeley 1 Llc | -- | None Available | |
| Hammond Management Llc | -- | -- | |
| Hammond Ara S | -- | -- |
Source: Public Records
Mortgage History
| Date | Status | Borrower | Loan Amount |
|---|---|---|---|
| Open | Lawrence Foley Ann | $760,000 |
Source: Public Records
Tax History
| Year | Tax Paid | Tax Assessment Tax Assessment Total Assessment is a certain percentage of the fair market value that is determined by local assessors to be the total taxable value of land and additions on the property. | Land | Improvement |
|---|---|---|---|---|
| 2025 | $13,836 | $735,982 | $215,635 | $527,347 |
| 2024 | $13,836 | $721,415 | $211,407 | $517,008 |
| 2023 | $13,421 | $714,134 | $207,262 | $506,872 |
| 2022 | $13,030 | $693,132 | $203,198 | $496,934 |
| 2021 | $13,039 | $679,407 | $199,215 | $487,192 |
| 2020 | $12,328 | $679,373 | $197,173 | $482,200 |
| 2019 | $11,809 | $666,054 | $193,308 | $472,746 |
| 2018 | $11,572 | $652,994 | $189,517 | $463,477 |
| 2017 | $18,040 | $1,200,000 | $360,000 | $840,000 |
| 2016 | $4,293 | $89,581 | $66,688 | $22,893 |
| 2015 | $4,201 | $88,235 | $65,686 | $22,549 |
| 2014 | $4,186 | $86,507 | $64,400 | $22,107 |
Source: Public Records
Map
Nearby Homes
- 2315 Eunice St
- 2121 Eunice St
- 1004 Cragmont Ave
- 938 San Benito Rd
- 1106 Cragmont Ave
- 2501 Rose Walk
- 962 Regal Rd
- 1950 Hopkins St
- 2686 Shasta Rd
- 1165 Cragmont Ave
- 1444 Walnut St
- 1408 Henry St
- 1515 Oxford St Unit 1D
- 1155 Keeler Ave
- 1110 Sterling Ave
- 813 San Diego Rd
- 1024 Grizzly Peak Blvd
- 1622 Scenic Ave
- 777 Cragmont Ave
- 1425 Martin Luther King jr Way
Your Personal Tour Guide
Ask me questions while you tour the home.