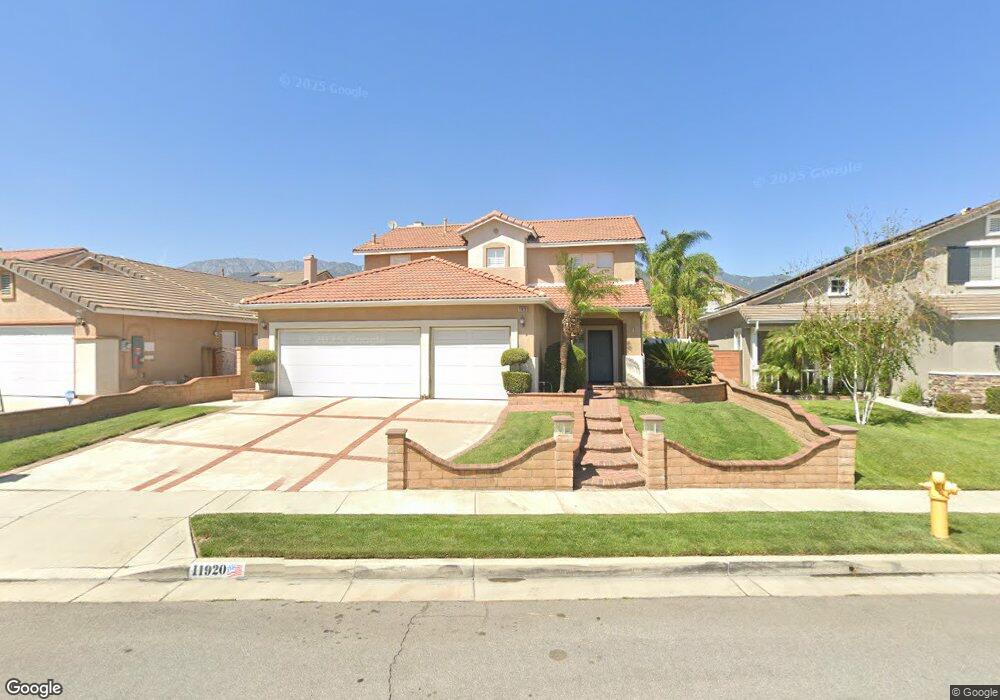
11920 Ardmoor Ct Rancho Cucamonga, CA 91739
Victoria NeighborhoodEstimated Value: $817,827 - $845,000
4
Beds
3
Baths
1,821
Sq Ft
$457/Sq Ft
Est. Value
About This Home
This home is located at 11920 Ardmoor Ct, Rancho Cucamonga, CA 91739 and is currently estimated at $831,957, approximately $456 per square foot. 11920 Ardmoor Ct is a home located in San Bernardino County with nearby schools including Carleton P. Lightfoot Elementary, Day Creek Intermediate, and Rancho Cucamonga High School.
Ownership History
Date
Name
Owned For
Owner Type
Purchase Details
Closed on
Feb 16, 2017
Sold by
Department Of Veterans Affairs Of The St
Bought by
Flores Carlos R
Current Estimated Value
Home Financials for this Owner
Home Financials are based on the most recent Mortgage that was taken out on this home.
Original Mortgage
$750,000
Interest Rate
4.15%
Mortgage Type
Reverse Mortgage Home Equity Conversion Mortgage
Purchase Details
Closed on
Apr 15, 2002
Sold by
Va
Bought by
Flores Carlos R
Purchase Details
Closed on
Mar 14, 2002
Sold by
Koh Romeo V and Koh Amparo
Bought by
Va
Purchase Details
Closed on
Nov 7, 1997
Sold by
William Lyon Homes Inc
Bought by
Koh Romeo Villegas and Camacho Amparo
Home Financials for this Owner
Home Financials are based on the most recent Mortgage that was taken out on this home.
Original Mortgage
$170,700
Interest Rate
6.95%
Create a Home Valuation Report for This Property
The Home Valuation Report is an in-depth analysis detailing your home's value as well as a comparison with similar homes in the area
Home Values in the Area
Average Home Value in this Area
Purchase History
| Date | Buyer | Sale Price | Title Company |
|---|---|---|---|
| Flores Carlos R | -- | Spl Title Services | |
| Flores Carlos R | -- | New Century Title Company | |
| Va | -- | New Century Title Company | |
| Koh Romeo Villegas | $180,000 | Orange Coast Title |
Source: Public Records
Mortgage History
| Date | Status | Borrower | Loan Amount |
|---|---|---|---|
| Previous Owner | Flores Carlos R | $750,000 | |
| Previous Owner | Koh Romeo Villegas | $170,700 |
Source: Public Records
Tax History Compared to Growth
Tax History
| Year | Tax Paid | Tax Assessment Tax Assessment Total Assessment is a certain percentage of the fair market value that is determined by local assessors to be the total taxable value of land and additions on the property. | Land | Improvement |
|---|---|---|---|---|
| 2025 | $4,636 | $369,330 | $88,642 | $280,688 |
| 2024 | $4,636 | $362,088 | $86,904 | $275,184 |
| 2023 | $4,508 | $354,988 | $85,200 | $269,788 |
| 2022 | $4,431 | $348,027 | $83,529 | $264,498 |
| 2021 | $4,351 | $341,203 | $81,891 | $259,312 |
| 2020 | $4,301 | $337,704 | $81,051 | $256,653 |
| 2019 | $4,199 | $331,083 | $79,462 | $251,621 |
| 2018 | $4,189 | $324,591 | $77,904 | $246,687 |
| 2017 | $4,010 | $318,226 | $76,376 | $241,850 |
| 2016 | $3,901 | $311,986 | $74,878 | $237,108 |
| 2015 | $3,866 | $307,299 | $73,753 | $233,546 |
| 2014 | $3,772 | $301,279 | $72,308 | $228,971 |
Source: Public Records
Map
Nearby Homes
- 11948 Stegmeir Dr
- 6988 Edinburgh Place
- 7070 Pozallo Place
- 7139 Scalea Place
- 12164 Wembley Ct
- 7358 Freedom Place
- 6999 Canosa Place
- 7343 Legacy Place
- 6992 Fontaine Place
- 7116 Sapri Place
- 7384 Solstice Place
- 7067 Fontaine Place
- 7397 Solstice Place
- 11855 Modena Dr
- 6701 Marsala Place
- 12206 Tunbridge Ct
- 7449 Solstice Place
- 7459 Solstice Place
- 7068 Crocus Ct
- 7271 Venosa Place
- 11926 Ardmoor Ct
- 11914 Ardmoor Ct
- 11908 Ardmoor Ct
- 11932 Ardmoor Ct
- 11921 Stegmeir Dr
- 11915 Stegmeir Dr
- 11927 Stegmeir Dr
- 11909 Stegmeir Dr
- 11933 Stegmeir Dr
- 11940 Ardmoor Ct
- 11923 Ardmoor Ct
- 11917 Ardmoor Ct
- 11902 Ardmoor Ct
- 11929 Ardmoor Ct
- 7020 Edinburgh Place
- 11939 Stegmeir Dr
- 11937 Ardmoor Ct
- 11905 Ardmoor Ct
- 11948 Ardmoor Ct
- 7014 Edinburgh Place