
Landlord's Agent in 2023
Alina Yarakhmedova
TTR Sotheby's International Realty
(240) 401-8048
21 Total Sales


Estimated Value: $604,610 - $697,000
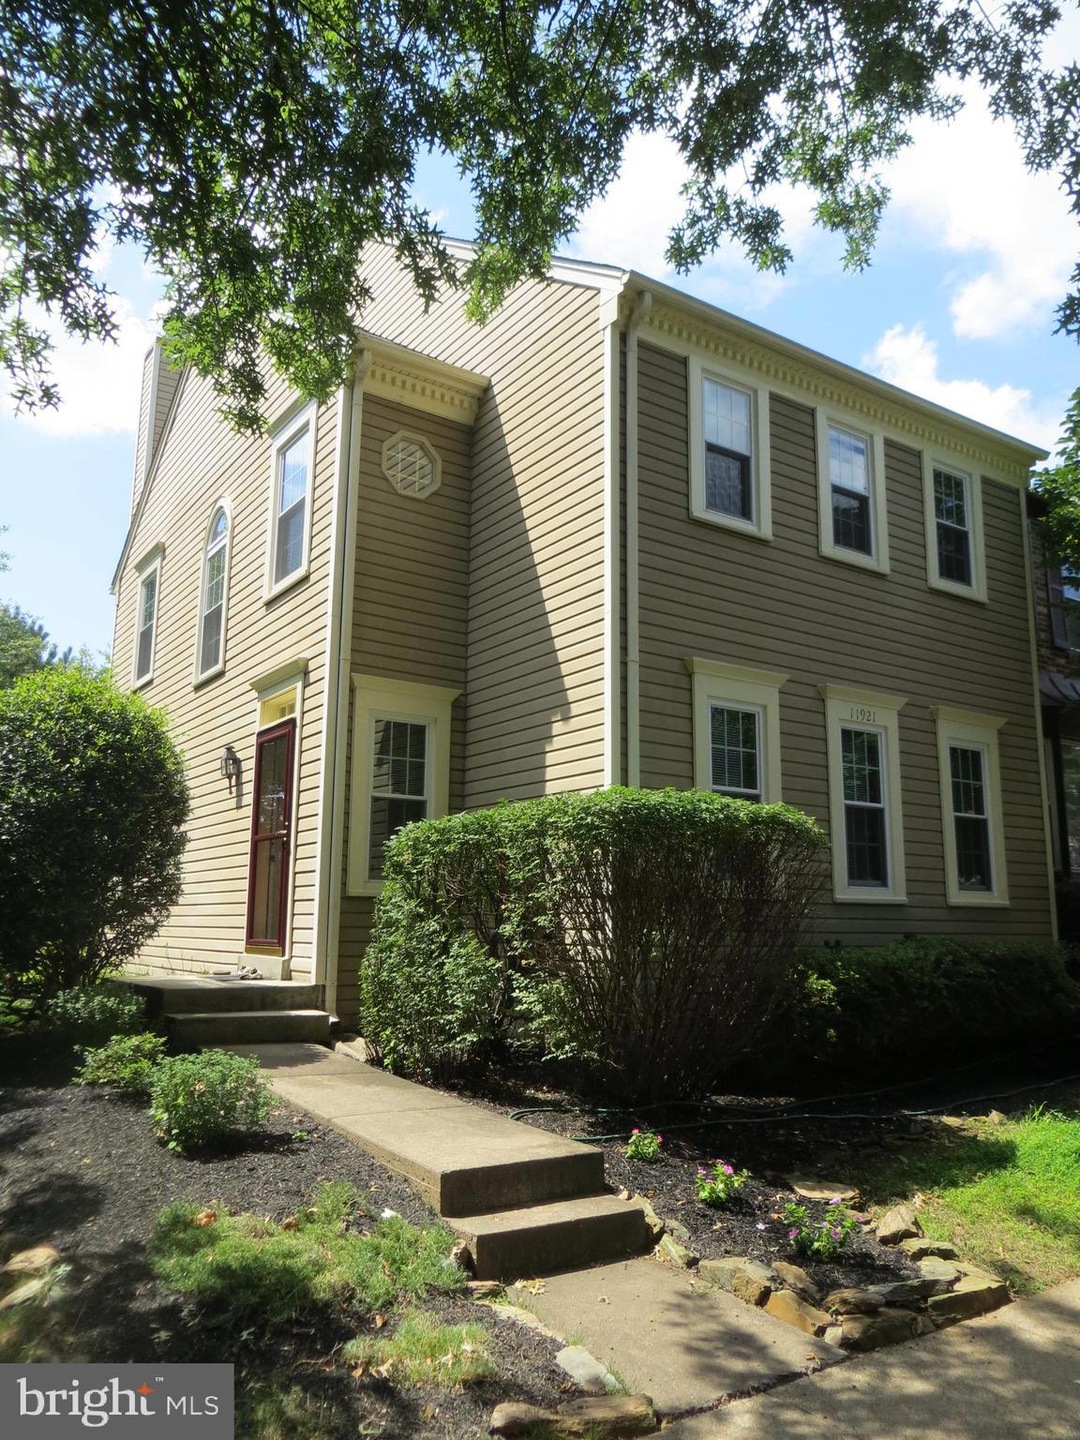
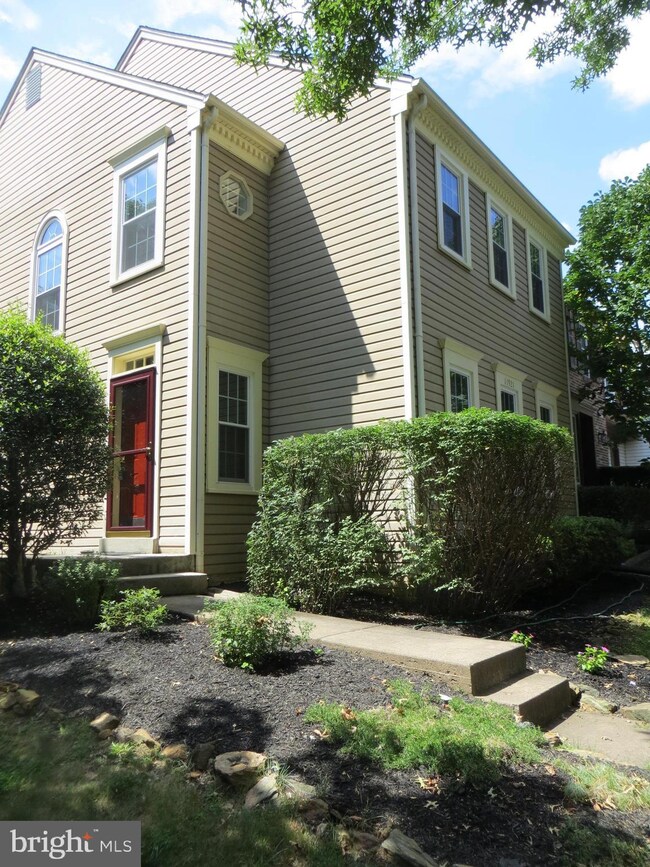
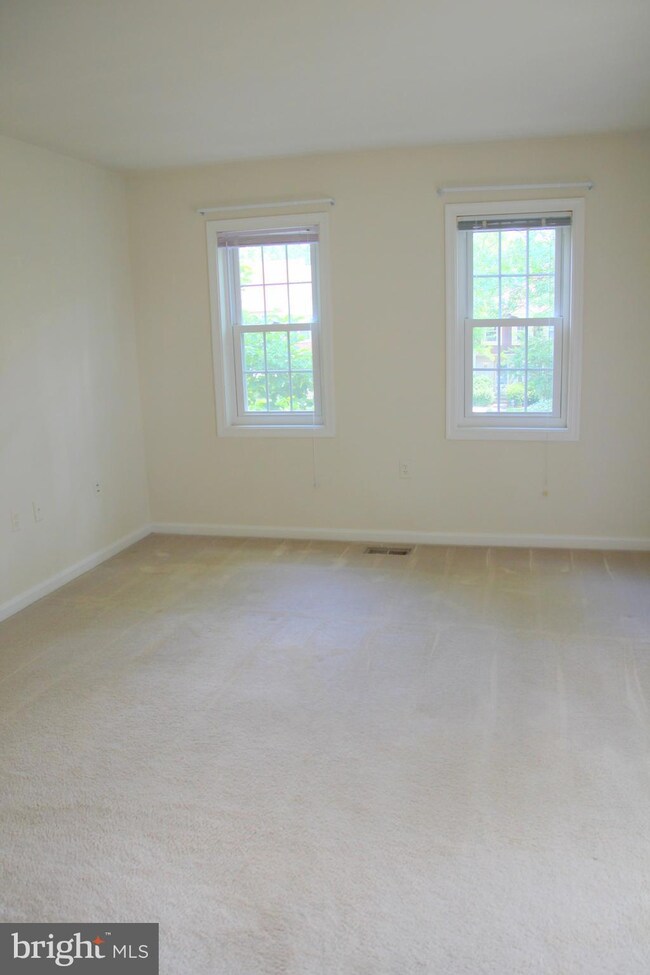
End unit, spacious and refreshed for a new tenant. Three finished levels, main level with living room, dining room and kitchen w/ breakfast area. Master Bedroom w/full bath and walk in closet. Two more bedrooms upstairs as well as another w/ full bath. Lower level recreation room with fire place, den, wet bar and laundry room. Located close to shopping center and schools, parks.
Last Agent to Rent the Property
(240) 401-8048 ayarakhmedova@ttrsir.com TTR Sothebys International Realty License #5004171 Listed on: 07/05/2023
Last Renter's Agent
(240) 401-8048 ayarakhmedova@ttrsir.com TTR Sothebys International Realty License #5004171 Listed on: 07/05/2023
| Date | Event | Price | List to Sale | Price per Sq Ft |
|---|---|---|---|---|
| 08/31/2023 08/31/23 | Rented | $2,750 | -1.8% | -- |
| 07/05/2023 07/05/23 | For Rent | $2,800 | +22.0% | -- |
| 06/23/2017 06/23/17 | Rented | $2,295 | 0.0% | -- |
| 06/23/2017 06/23/17 | Under Contract | -- | -- | -- |
| 05/25/2017 05/25/17 | For Rent | $2,295 | 0.0% | -- |
| 07/17/2015 07/17/15 | Rented | $2,295 | +4.6% | -- |
| 07/17/2015 07/17/15 | Under Contract | -- | -- | -- |
| 05/20/2015 05/20/15 | For Rent | $2,195 | +11.1% | -- |
| 08/27/2013 08/27/13 | Rented | $1,975 | -1.0% | -- |
| 08/27/2013 08/27/13 | Under Contract | -- | -- | -- |
| 08/04/2013 08/04/13 | For Rent | $1,995 | -- | -- |
| Year | Tax Paid | Tax Assessment Tax Assessment Total Assessment is a certain percentage of the fair market value that is determined by local assessors to be the total taxable value of land and additions on the property. | Land | Improvement |
|---|---|---|---|---|
| 2025 | $6,302 | $592,310 | $180,000 | $412,310 |
| 2024 | $6,302 | $522,790 | $170,000 | $352,790 |
| 2023 | $6,172 | $525,060 | $170,000 | $355,060 |
| 2022 | $5,942 | $519,620 | $170,000 | $349,620 |
| 2021 | $5,592 | $458,150 | $160,000 | $298,150 |
| 2020 | $6,251 | $469,990 | $160,000 | $309,990 |
| 2019 | $3,072 | $459,360 | $155,000 | $304,360 |
| 2018 | $5,148 | $447,660 | $151,000 | $296,660 |
| 2017 | $2,755 | $430,840 | $140,000 | $290,840 |
| 2016 | $3,042 | $426,520 | $140,000 | $286,520 |
| 2015 | $4,863 | $418,170 | $140,000 | $278,170 |
| 2014 | $2,637 | $408,170 | $130,000 | $278,170 |
Landlord's Agent in 2023
Alina Yarakhmedova
TTR Sotheby's International Realty
(240) 401-8048
21 Total Sales
Seller's Agent in 2017
Samer Kuraishi
Samson Properties
(301) 385-0049
99 Total Sales
N
Seller Co-Listing Agent in 2017
Nilesh Kumar
One Street
Buyer's Agent in 2017
JAMIA SMITH
DMV Realty, INC.
(703) 986-4505
18 Total Sales
Buyer's Agent in 2015
Amy Shafer
Fathom Realty
(703) 899-5540
19 Total Sales
Buyer's Agent in 2013
Sherry Spinelli
Long & Foster
(571) 215-2382
2 in this area
6 Total Sales
Source: Bright MLS
MLS Number: VAFX2132956
APN: 0271-12020045
Disclaimer: Certain information contained herein is derived from information provided by parties other than Homes.com. All information provided is deemed reliable, but is not guaranteed to be accurate and should be independently verified.
![]() The data relating to real estate for sale on this website appears in part through the BRIGHT Internet Data Exchange program, a voluntary cooperative exchange of property listing data between licensed real estate brokerage firms, and is provided by BRIGHT through a licensing agreement.
The data relating to real estate for sale on this website appears in part through the BRIGHT Internet Data Exchange program, a voluntary cooperative exchange of property listing data between licensed real estate brokerage firms, and is provided by BRIGHT through a licensing agreement.
Listing information is from various brokers who participate in the Bright MLS IDX program and not all listings may be visible on the site.
The property information being provided on or through the website is for the personal, non-commercial use of consumers and such information may not be used for any purpose other than to identify prospective properties consumers may be interested in purchasing.
Some properties which appear for sale on the website may no longer be available because they are for instance, under contract, sold or are no longer being offered for sale.
Property information displayed is deemed reliable but is not guaranteed.
Copyright 2025 Bright MLS, Inc.